


The Physical Side and the Financial Side, in one Place
Capital Intelligence ties the physical side of midstream, flows, throughput and rig activity, directly to the financial side: earnings, cash flow and valuation, across more than 20 midstream companies.
Every assumption behind a number is shown rather than buried, so when your figure differs from someone else’s you can say exactly why.
Built for the people who have to defend a number: analysts and portfolio teams weighing a position, and strategy and commercial teams weighing a project.
Four Kinds of CoveragE
Everything in Capital Intelligence sits in one of four groups. Each one names what is in it, so you can go straight to the part you need.
Equity Coverage
Company Performance, Compared
Company-specific models, earnings previews and peer comparison across more than 20 midstream companies. Every assumption behind a forecast is shown, so a difference between your number and ours is something you can trace rather than argue about.
What is in it?
- Peer Comparison Tool
- Individual Company Coverage

Commodity Coverage
The fundamentals underneath the financials
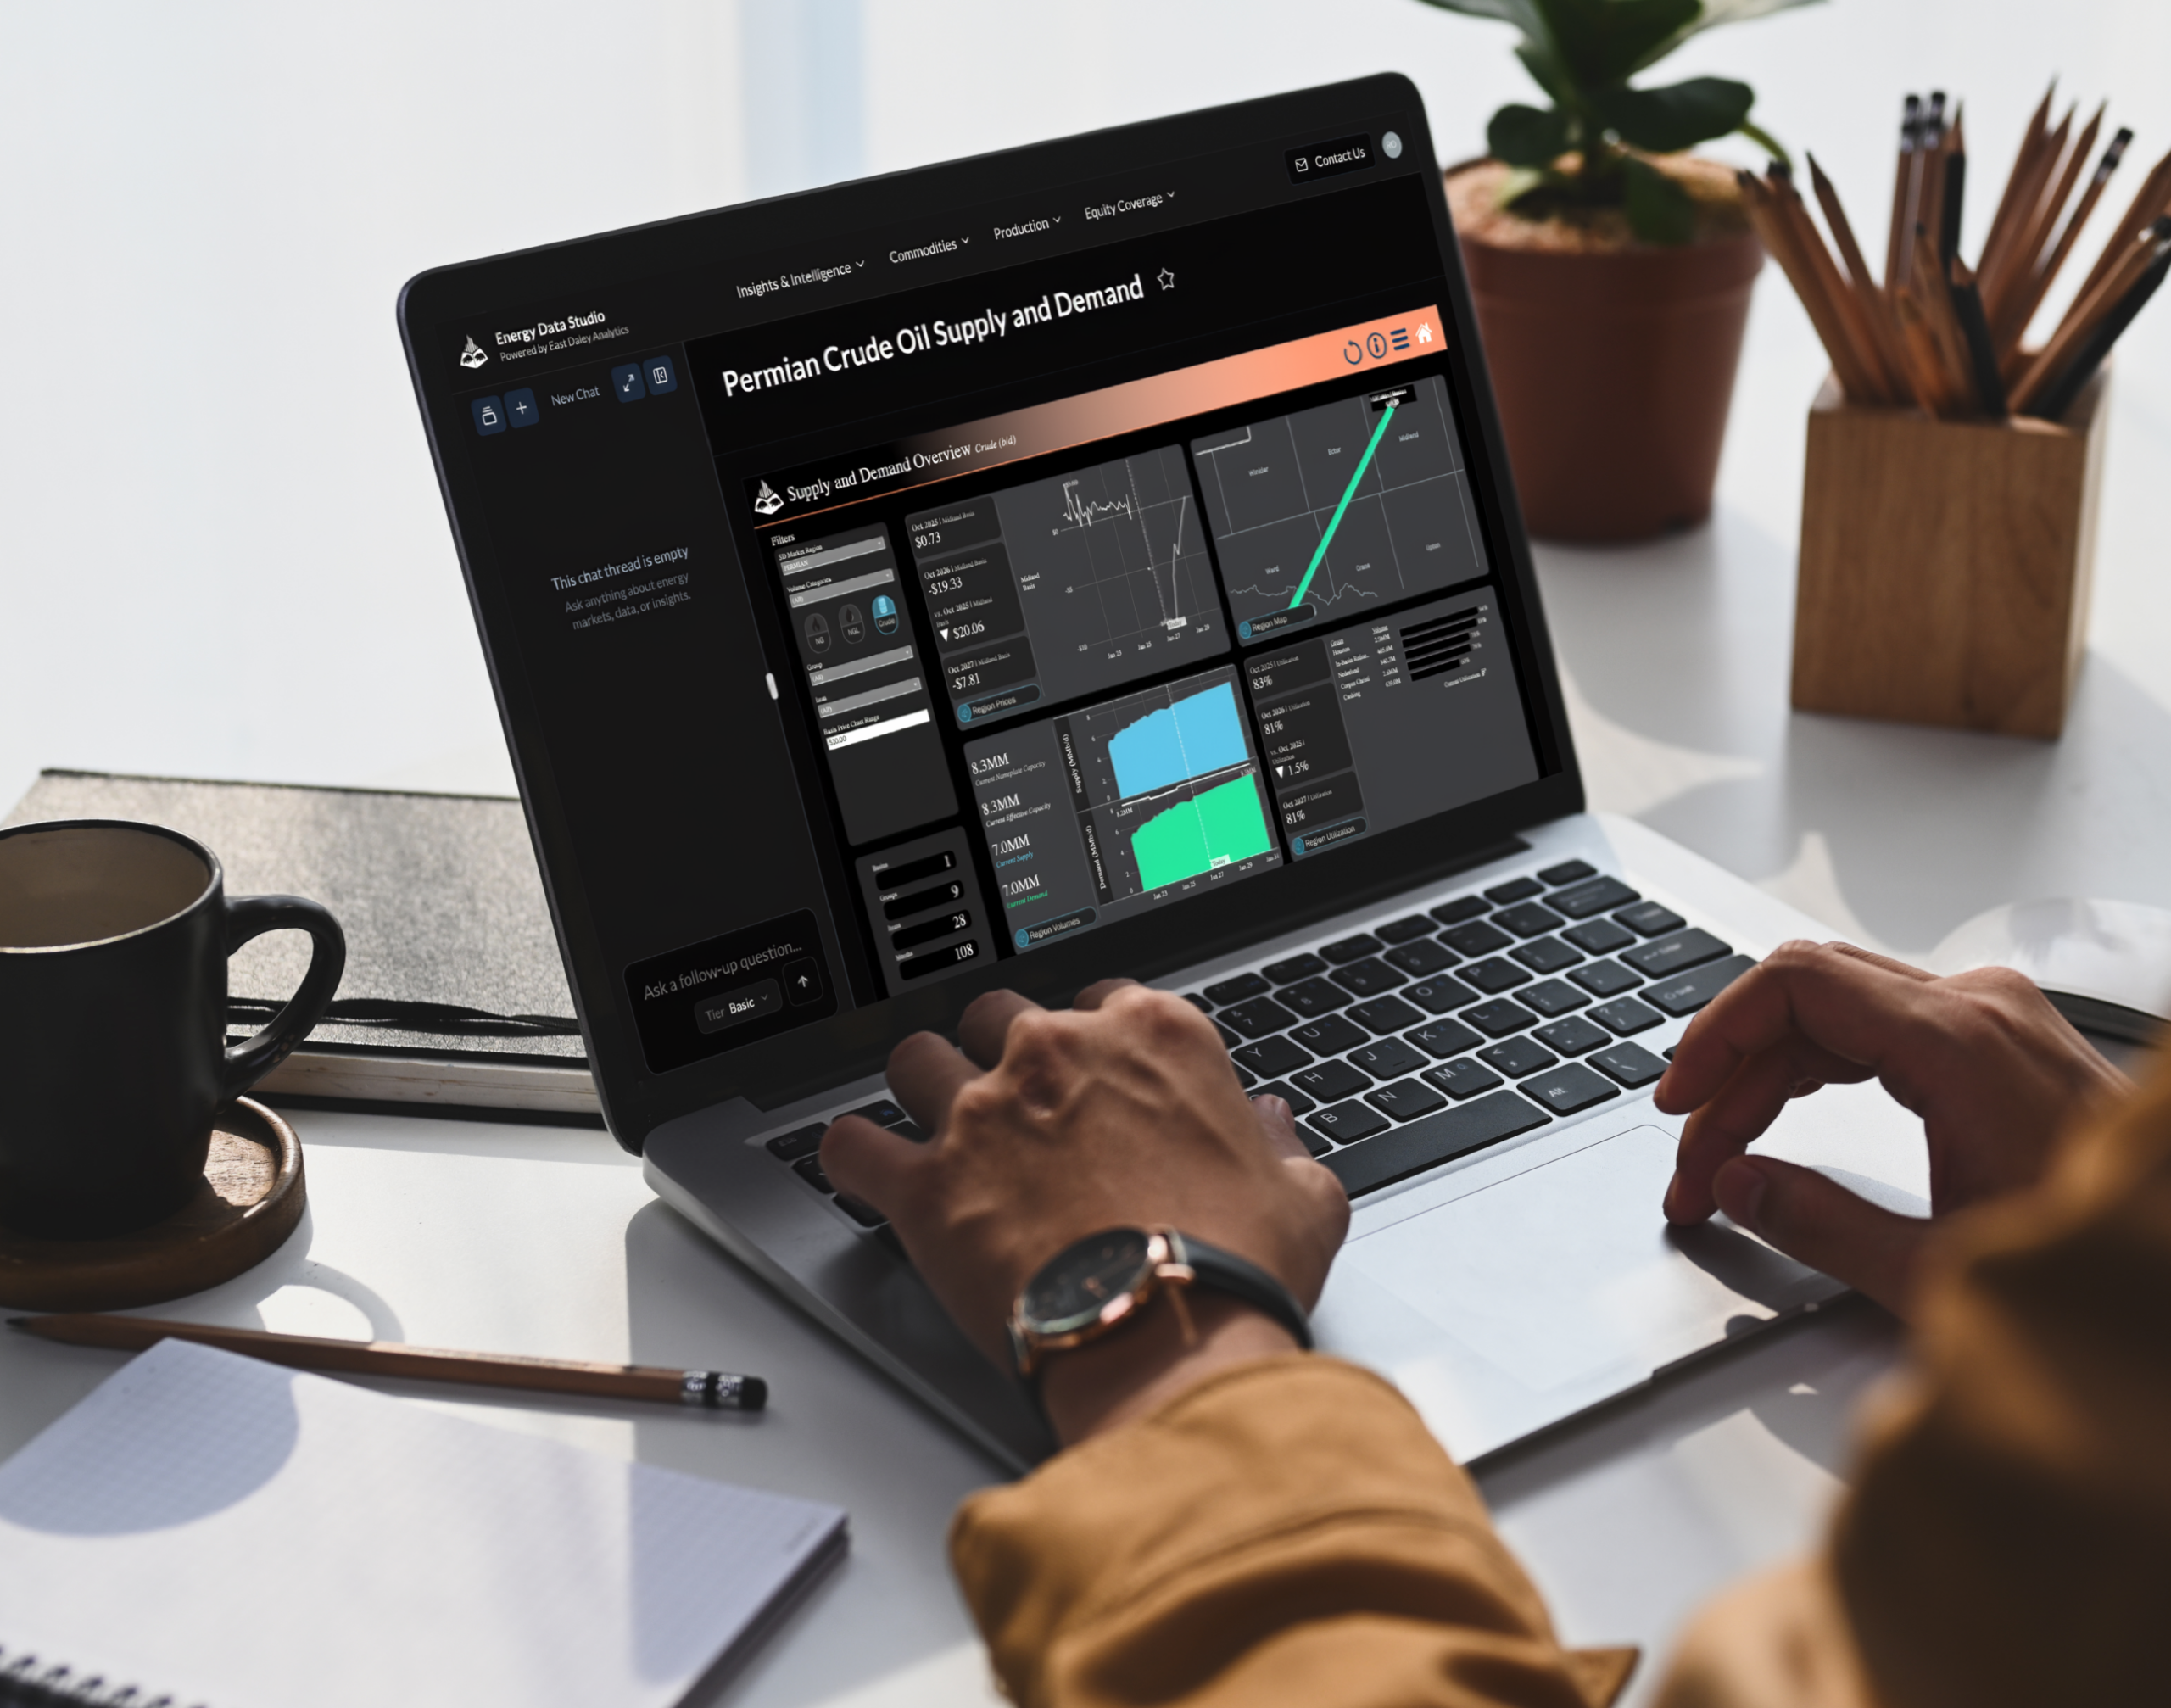
Company financials move on commodity fundamentals, not in isolation. Supply and demand forecasts across natural gas, crude and NGLs feed the same models that cover the companies you are looking at.
What is in it?
Asset-level Intelligence
The pipeline, plant or system behind the number
Throughput, rig activity and utilization tied to the company financials they drive, across geographies most models treat as a single line item.
What is in it?
- G&P Comparison Tool
- G&P System Analysis
- G&P System Financials
- Rig Activity Tracker
- Producer to System Analysis
- Processing Plant Detail
- Gas Pipeline Customer Contracts
- Crude Hub Model
- NGL Hub Model


Asset-level Market Data
The filings, structured
FERC, RRC and other regulatory filings across more than 1,000 pipelines and midstream assets, structured so you can calculate returns and benchmark performance yourself rather than read someone else’s summary.
What is in it?
- FERC Form 2
- FERC Form 6
- FERC Index of Customers
- FERC Return Calculator
Built on analysts, not just a dashboard
Every number here comes with someone who can defend it. When a dashboard raises a question the data alone cannot answer, East Daley’s midstream analysts are a call away. Not a support ticket, a conversation.
What the models cover
More than 1,300 assets
22 public midstream companies
More than 1,000 pipelines and midstream assets covered by FERC, RRC and other filings
 Capital Intelligence (Energy Financial Analytics) FAQs
Capital Intelligence is East Daley Analytics’ suite of energy financial and market analysis, tying detailed midstream operational data, production, pipeline flows and rig activity, to asset-level financial metrics for more than 20 midstream companies. It is built so market trends and company performance can be assessed side by side rather than as two separate research exercises.
Energy-focused financial professionals and strategic decision-makers: investment analysts, portfolio managers, investment bankers, and corporate strategy executives in oil and gas. If you value midstream assets, pick winners and losers among energy companies, or forecast how market shifts hit financial performance, it is built around that work
Separate. Capital Intelligence used to sit inside the Commodities section and now has a page of its own. Commodity coverage is one of its four parts, because company financials move on commodity fundamentals rather than in isolation, but Commodities is where you go for natural gas, crude oil and NGLs on their own.
Yes. Capital Intelligence is delivered via the Energy DataStudio® platform, which is where the equity dashboards, commodity data, asset-level models and related reports all sit.
Most financial data providers give you reported financials. Capital Intelligence links physical market reality, pipeline flows, rig counts and production forecasts, directly to the financial projections, with the assumptions exposed rather than buried.
East Daley Analytics aggregates data from FERC, state agencies, EIA and company reports, cross-checking one source against another, and reconciles its asset-level projections with companies’ reported financials each quarter. Clients can see the inputs and assumptions rather than take a number on trust
Weekly for operational data, monthly for larger releases and comparative dashboards, and quarterly for full financial model updates and earnings-season reviews.
Yes. Subscribers can reach East Daley’s midstream analysts directly to interpret the data, walk through an assumption or navigate the platform. Not just software, but the expertise behind it.
Related Links





Built on the same asset-level data, with the analysts who help you use it
Capital Intelligence connects the physical and financial sides of midstream, so you are never defending a number you cannot explain.