What You Get with East Daley’s Crude Supply & Demand Solutions:

Supply and Demand Reports
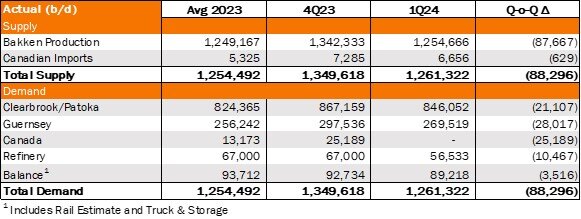
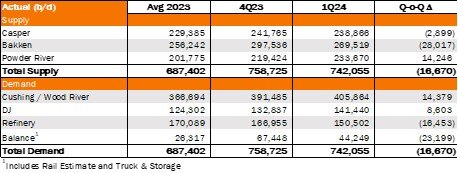
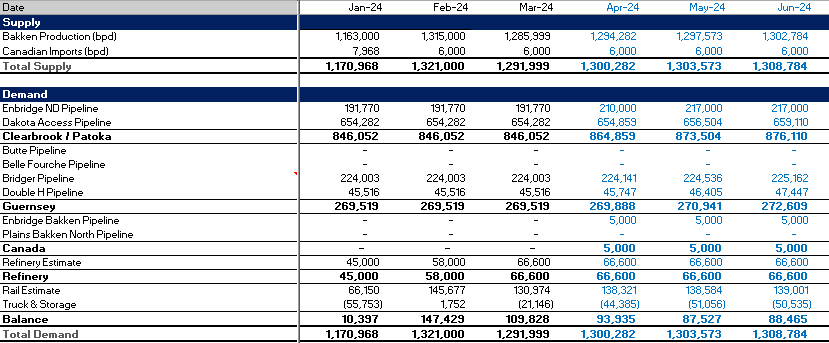
Monthly S&D reports with actuals and forecasted data on rig counts, crude pipeline utilization, production demand, and more.

Supply and Demand Data Files
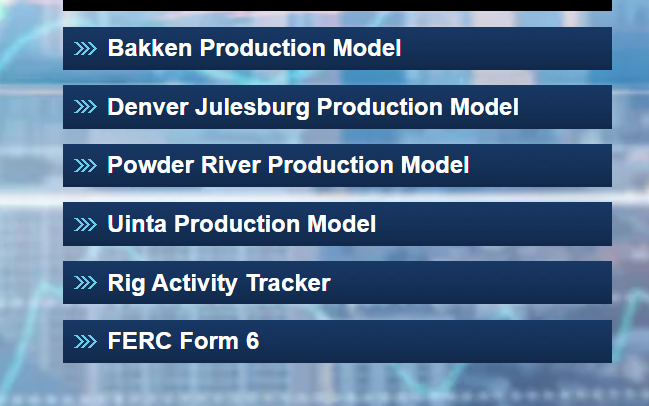
See data-driven EDA assumptions and changes over time with granular models for BAkken, DJ, PowderRiver, and Uinta.

Production Models
See all of the data behind our monthly S&D reports for unparalleled visibility into our crude oil forecasts and insights.

Energy Data Studio®
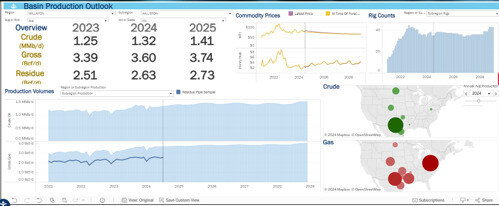
Easily access interactive production models, reconciled FERC Form 6 data, analyst insights, and downloadable reports and data sets.
Bakken-Guernsey-Dj Crude Oil Supply and Demand Reports
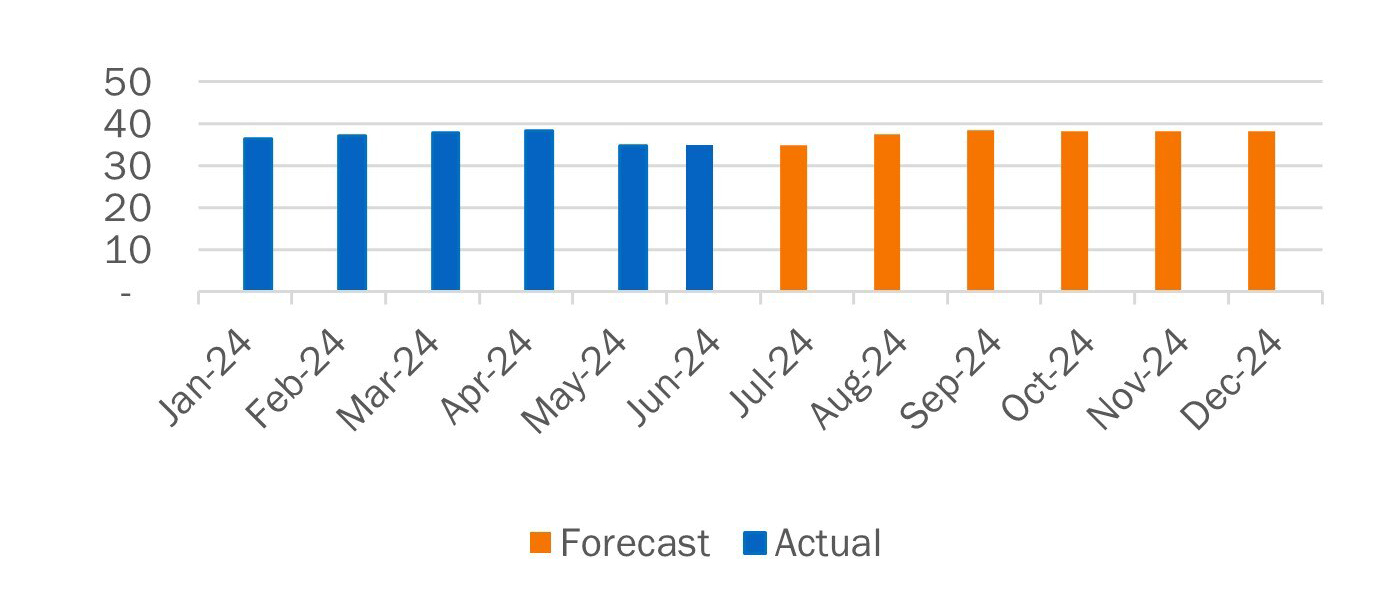
Get granular insights into basins and hubs across the Bakken-Guernsey-DJ region delivered to your inbox monthly with straightforward, no-nonsense analyst commentary on rig counts, pipeline utilization, flows, and demand, including forecasted vs. actual comparisons, for better risk management and more cost-efficient investments.
Shipper Contracts Across Gas Pipelines
Proactively adjust your operational strategies throughout hubs and basins based on forecasted vs. actual changes in supply and demand.
Pipeline Utilization, Flows, and Demand
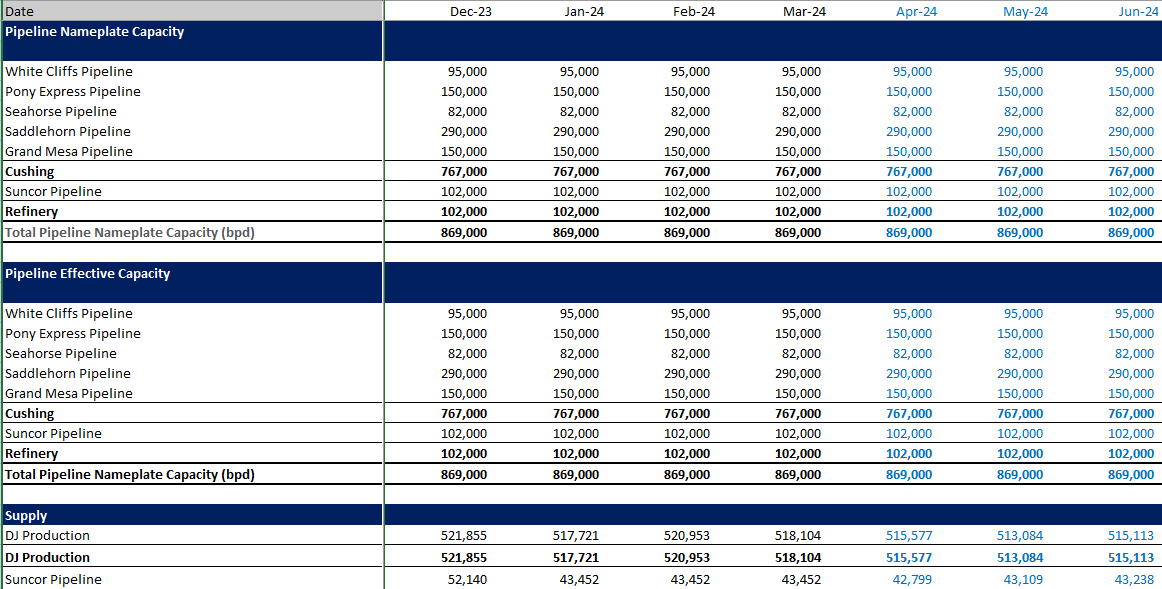
Drill down into pipeline egress, effective capacity and utilization, price, and demand across each crude pipeline through the Bakken-Guernsey-DJ region.
Included Pipelines:
-
Enbridge ND Pipeline
-
Dakota Access Pipeline
-
Double H Pipeline
-
Bridger Pipeline
-
Plains Bakken North Pipeline
-
Enbridge Bakken Pipeline
-
Cushing/Wood River Pipeline
-
White Cliffs Pipeline
-
Grand Mesa Pipeline
-
Pony Express Pipeline
-
Saddlehorn Pipeline
Supply and Demand Data Files
You should always be able to know where the insights and forecasts driving your strategic decision-making in the crude market are coming from. East Daley Analytics lets you see how the sausage gets made with the raw data behind our monthly crude oil supply and demand reports, broken down by pipeline, by month.
Interactive Crude Oil Production Models
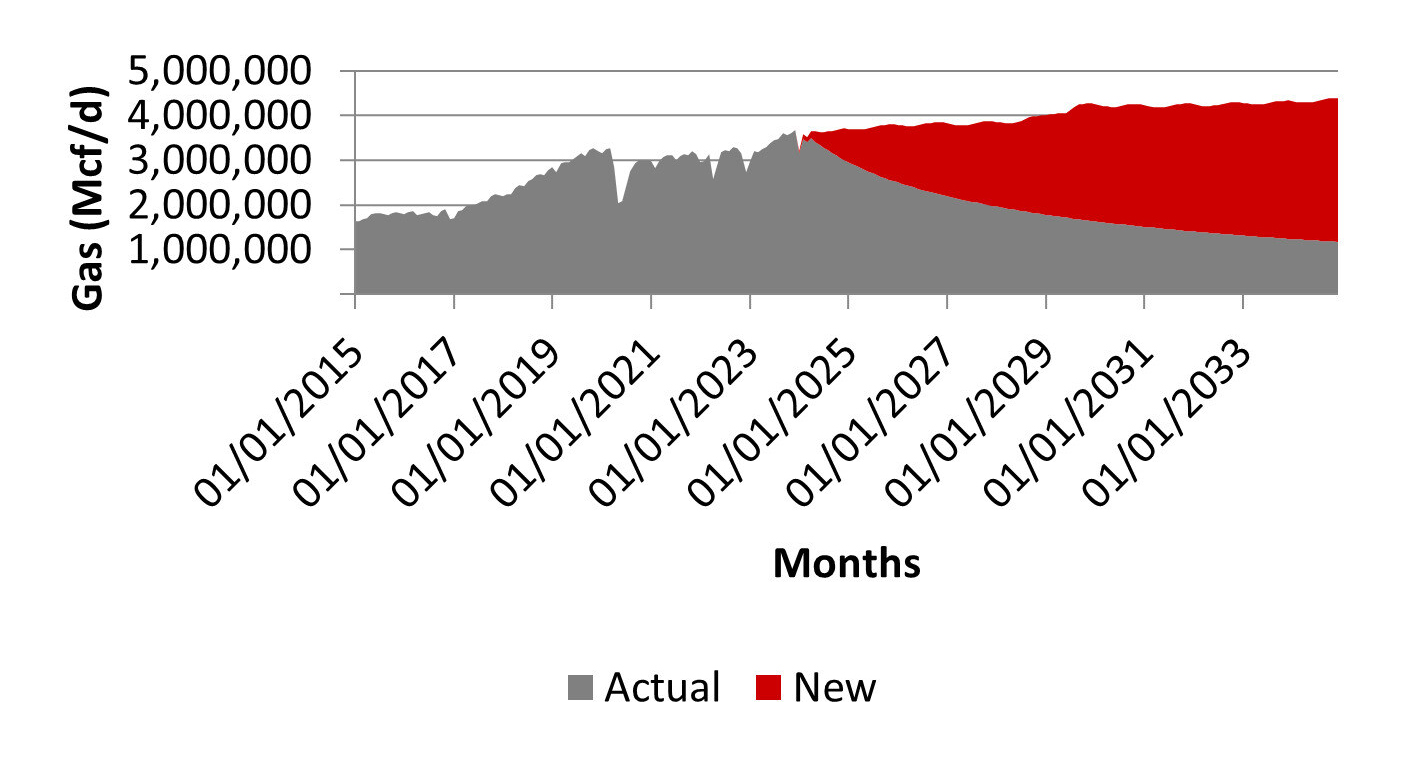
Refine your crude oil forecasting with a flexible, interactive tool based on our supply and demand reports and data sets. Our interactive crude oil production models help you check your assumptions against real data for:
- IP Rates for Gas and Oil
- Drill Times
- Downtime
- LNG Production
- Rig Counts
- Wells Drilled
- Gas Production
Energy Data Studio®
Filter data your way, control what you see, and drill down to granular sub-basin-level crude oil outlooks with East Daley Analytics’ game-changing asset-level allocation model. Energy Data Studi® puts all of East Daley’s crude market products at your fingertips like never before, with a user-friendly, dynamic visual interface you can customize to drill down into the most relevant basins and sub-basins to your strategic operations and investments.
What can you do with Energy Data Studio®?
- Integrate crude forecasts into a balanced hub-to-hub crude pipeline network model with our Crude Hub Model
- Cross-correlate expectations on crude with potential constraints from other commodities
- Provide historical and forecasted crude production and rig counts by basin and sub-basin
- Leverage a basin-level view of crude oil flow through markets and hubs
- Track pipeline flows across North America, highlighting egress opportunities and constraints
- Monitor the flow of crude oil into USGC export facilities and refineries
Reconciled FERC Form 6 Data
Download and explore current and archival data from the US Federal Energy Regulatory Commission’s quarterly and annual reports on the financial and operational performance of major interstate crude pipelines across the Bakken-Guernsey-DJ region. Vastly expand your insights into asset financial performance with non-GAAP financial metrics that empower you to see and seize new opportunities in the regional crude market before your competition.
Free Weekly Crude Oil Newsletter

With a subscription to Crude Oil Edge, you get weekly updates on the US crude market delivered straight to your inbox for free—including the basin and sub-basin dynamics of crude oil flows, infrastructure, and storage across North America. Get an edge over the competition for free with clear insights into crude oil flows, production growth and import/export characteristics across the Bakken-Guernsey-DJ region.
Contact Us
Questions about East Daley Analytics’ crude oil products? Reach out to our team:


