


Executive Summary:
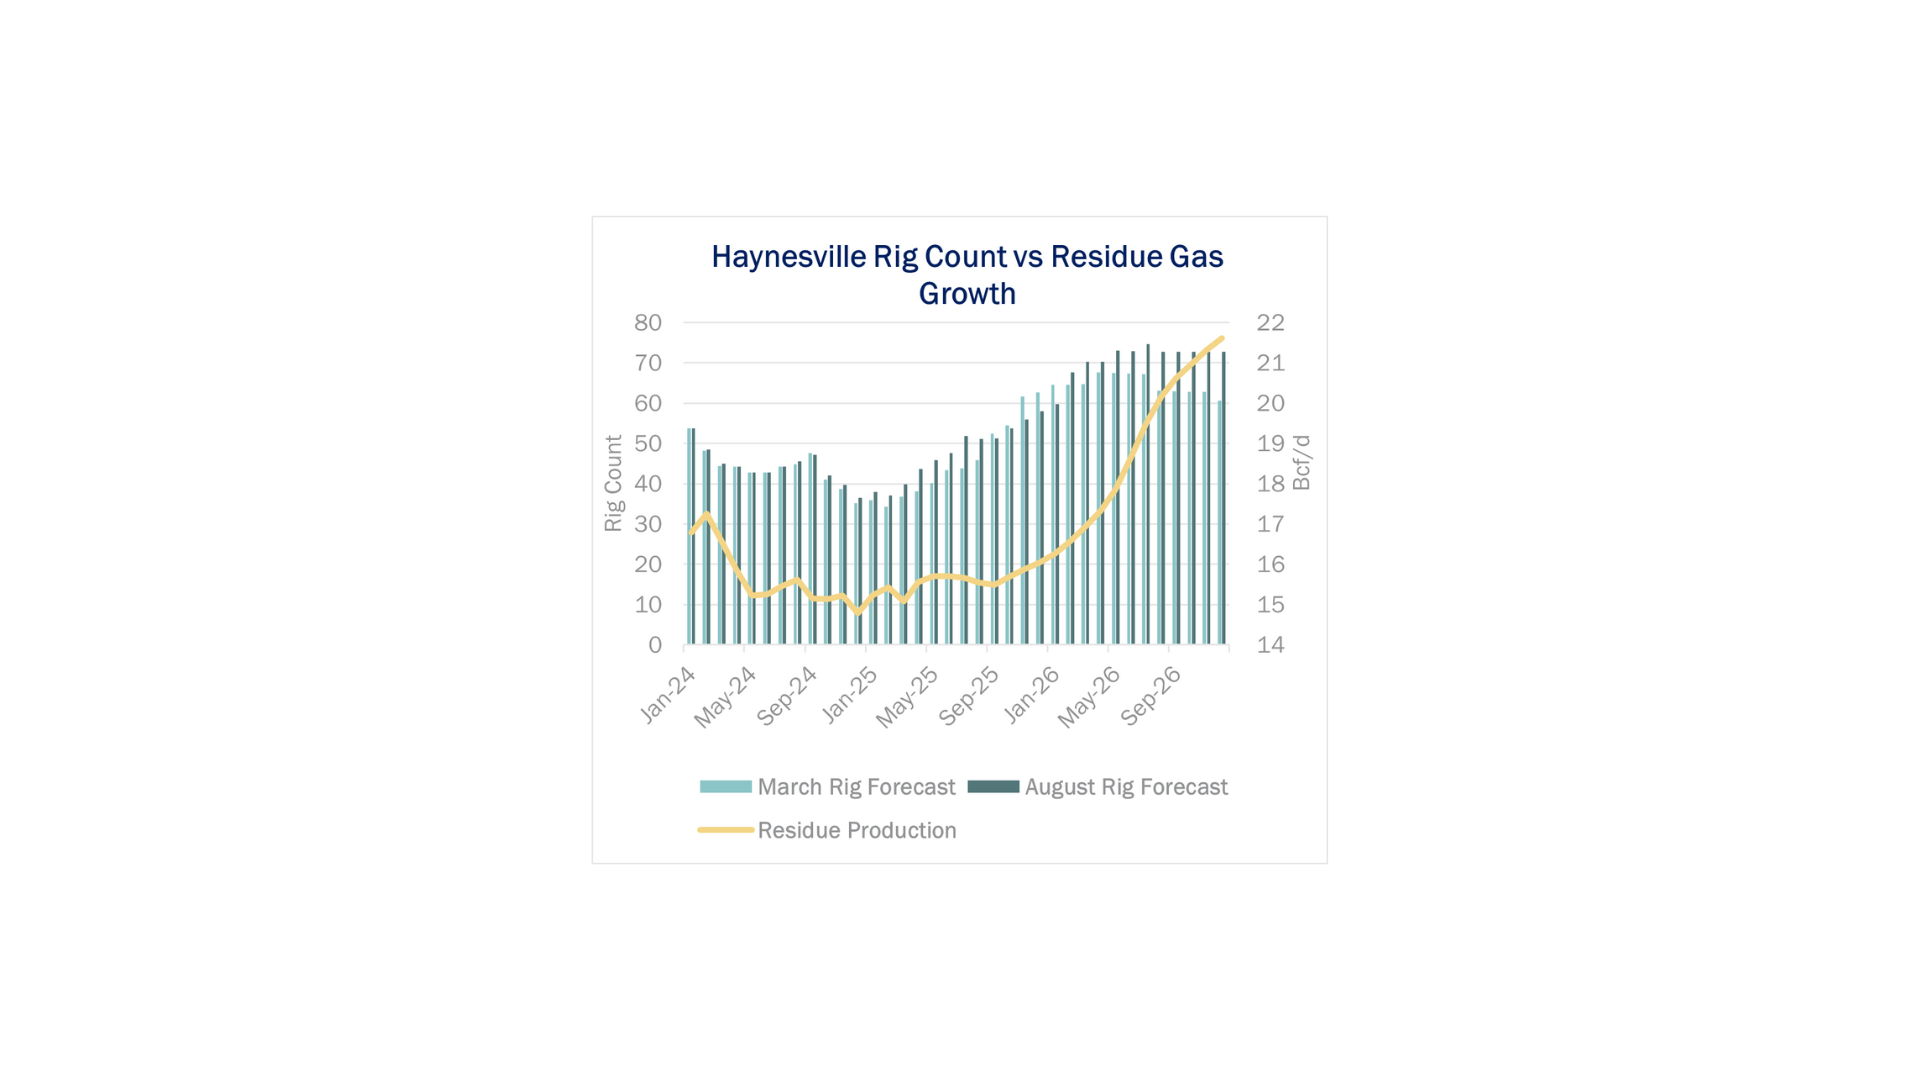
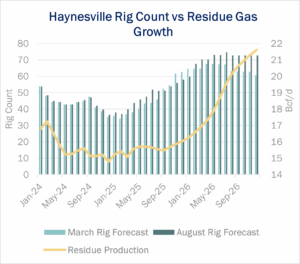
Infrastructure: After troughing in January, Haynesville rigs have steadily climbed through the year, reaching 55 rigs in August.
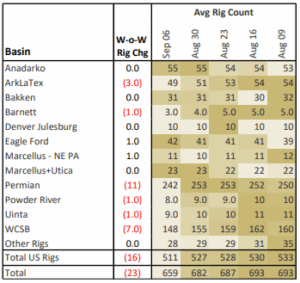
Rigs: The US lost 16 rigs for the week of Sep. 6, bringing the total rig count to 511.
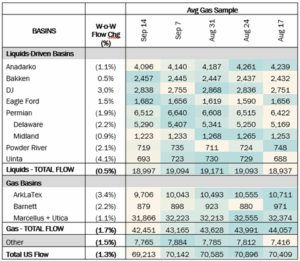
Flows: US natural gas volumes averaged 69.2 Bcf/d in pipeline samples for the week ending Sept. 14, down 1.3% W-o-W.
Storage: Traders expect the EIA to report a 79 Bcf injection for the week ending Sept. 14.
Infrastructure:
After troughing in January, Haynesville rigs have steadily climbed through the year, reaching 55 rigs in August. The ramp is in line with East Daley’s Macro Supply & Demand forecast from March, when we anticipated more drilling to meet growing Gulf Coast demand in 2026.
Most of the rig adds have come from private operators, who have been taking advantage of above-breakeven prices most of the year. The largest producers, namely Expand Energy (EXE) and Aethon, are playing a more measured game.
The current Haynesville rig count is skewed heavily towards exploratory drilling in East Texas, where we observed 30 rigs in the field in July, well above the maintenance level of ~20 rigs. This is in contrast to declining volumes out of that sub-region, indicating that a significant build of drilled but uncompleted wells (DUCs) is in progress.
Meanwhile, there is an equally drastic DUC burn on the Louisiana side of the basin. Drilling activity is hovering at roughly maintenance levels (22 rigs), but residue gas has grown over 1 Bcf/d since January. Looking forward, we expect ~13 rigs will be needed in the near term on the Louisiana side, as well as a DUC burn on the East Texas side, to balance the market in 2026.
On the demand side, Haynesville egress capacity and flows are growing. LEAP throughput cracked 2 Bcf/d for the first time and averaged 1.8 Bcf/d in August, and Williams’ (WMB) Louisiana Energy Gateway (LEG), which started operations in late July, is already delivering nearly 700 MMcf/d on average. Momentum’s NG3 project should be online before the end of the year and add another 1.7 Bcf/d of egress capacity. The NG3 line should help debottleneck some of the productive capacity in East Texas, where Momentum has an extensive gathering footprint.
These new pipes are needed to serve nearly 5 Bcf/d of new LNG demand expected in 2026. Growth will come from Golden Pass LNG (+2.6 Bcf/d), which is in the early stages of its ramp, as well as incremental gains at Plaquemines LNG (+3.9 Bcf/d) and Corpus Christi Stage 3 (+2.2 Bcf/d), both of which recently upsized their expected run-rate utilization (by 40% and 10% respectively).
Producer guidance is clear. EXE has no plans to add rigs yet and is adamant that other basins will need to chip in to meet LNG demand. As far as we can tell, Haynesville reserves are sufficient for the long term, but EXE is reluctant to burn through its premium acreage too quickly. While Haynesville wells boast higher initial production (IP) rates, the decline curves are correspondingly steeper. In any case, we find it difficult to find enough molecules beyond the Haynesville, especially at current prices, which means prices will rise before both the Haynesville and other basins are incentivized to move.
Rigs:
The US lost 16 rigs for the week of Sep. 6, bringing the total rig count to 511. The Eagle Ford (+1), Marcellus – NE PA (+1) gained rigs and the Permian (-11), WCSB (-7), ArkLaTex (-3), Barnett (-1), Powder River (-1), Uinta (-1) lost rigs W-o-W.
At the company level EPD (+2), PSX (+1), WMB (+1) gained rigs and WES (-4), ET (-2), TRGP (-2), MPLX (-2), KMI (-2), OKE (-1), Brazos Midstream (-1) lost rigs W-o-W.
See East Daley Analytics’ weekly Rig Activity Tracker for more information on rigs by basin and company.
Flows:
US natural gas volumes averaged 69.2 Bcf/d in pipeline samples for the week ending Sept. 14, down 1.3% W-o-W.
Major gas basin samples declined 1.7% W-o-W to 42.5 Bcf/d. The Haynesville sample decreased 3.4% to 9.7 Bcf/d, and the Marcellus+Utica sample dropped 1.1% to 31.9 Bcf/d.
Samples in liquids-focused basins declined 0.5% W-o-W to 19.0 Bcf/d. The Eagle Ford sample rose 1.5% to 1.7 Bcf/d, while the DJ sample increased 3.0% after declining 4.0% the week before.
Storage:
Traders and analysts expect the Energy Information Administration (EIA) to report a net injection of 79 Bcf for the week ending September 5. An injection of 79 Bcf would increase the surplus to the five-year average by 5 Bcf to 193 Bcf. The storage deficit versus last year would fall by 23 Bcf and sit at just 15 Bcf.
With inventory levels approaching last year end of injection season level, 2024 and 2025 will be only the second time where storage has eclipsed 3.9 Tcf in consecutive years. The end of injection season in 2015 and 2016 also saw 3.9 Tcf and eventually both years topped out above 4.0 Tcf as injections piled on into the first few weeks of November. The prompt month October remains strong near $3.10 despite these heady storage levels. Cash is also perking up as warm weather parks itself over Texas and the Gulf Coast for the next week.
See the latest Macro Supply & Demand Report for more analysis on the storage outlook.
Calendar:

Subscribe to East Daley’s The Daley Note (TDN) for midstream insights delivered daily to your inbox. The Daley Note covers news, commodity prices, security prices, and EDA research likely to affect markets in the short term.