Executive Summary:
Infrastructure: We’re Not Buying EIA’s ‘Chicken Little’ Oil Forecast.
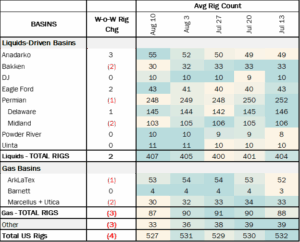
Rigs: The total US rig count decreased during the week of Aug 10 to 527 .
Supply & Demand: The US natural gas pipeline sample, a proxy for change in oil production, increased 0.8% W-o-W across all liquids-focused basins.
Rigs:
The total US rig count decreased during the week of Aug 10 to 527. Liquids-driven basins increased by 2 rigs W-o-W from 405 to 407.
- Anadarko (+3): Suncor Energy Inc., RJM CO
- Eagle Ford (+2): Pillar Oil & Gas, Mitsui
- Bakken (-2): Conoco Phillips Company, Devon Energy Corporation
- Permian (-1):
- Midland (-2): Vital Energy, Exxon
- Delaware (+1): U.S. Development Corp
Infrastructure:
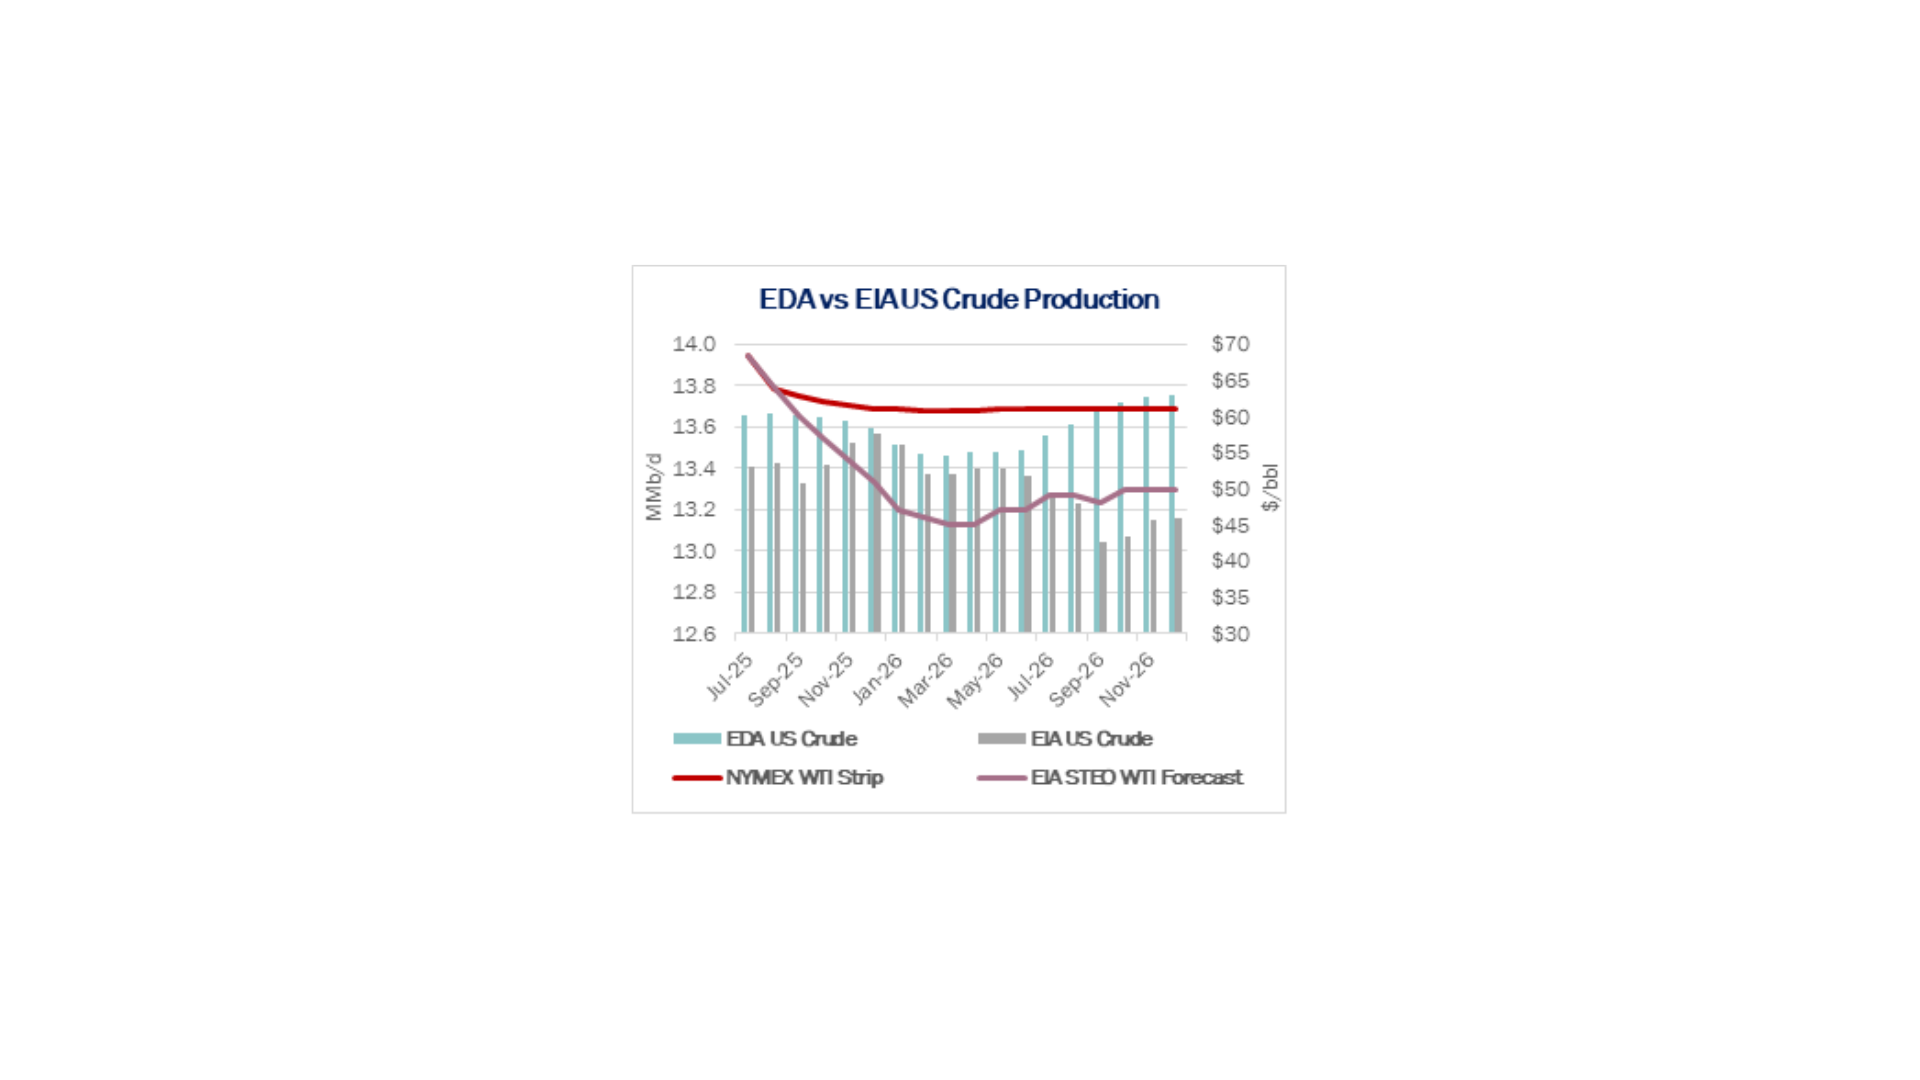
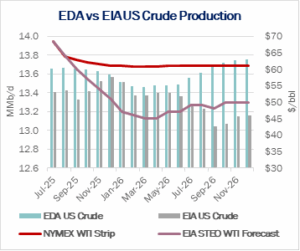
The EIA has turned heads with a bearish call on crude oil. The agency now predicts prices will fall to around $50/bbl in early 2026, and US oil production will decline by 400 Mb/d next year. East Daley is more optimistic, and don’t expect the bottom to fall out of oil markets.
In its August Short-Term Energy Outlook (STEO), the EIA predicts US crude oil production will reach an all-time high of 13.6 MMb/d in Dec ‘25, then decline to 13.2 MMb/d by Dec ‘26. Lower prices, combined with more anticipated supply from OPEC+ members, are behind the bearish outlook. The latest STEO predicts Brent prices will average $51/bbl in 2026.
Market sentiment soured following ‘Liberation Day’ on April 2. WTI prices fell from a $68.24/bbl average in March to $63.54 in April and $62.17 in May. Producers responded by revising down their 2025 guidance, lowering capex budgets and idling more rigs. Prices have rebounded since, with WTI settling at $68.39 in July. Many operators expect to maintain or have even increased their guidance.
However, OPEC+ members in July agreed to accelerate the timeline for unwinding 2.2 MMb/d of production cuts the cartel implemented in Nov ’23. The curtailments, originally scheduled to be fully unwound by Sept ’26, will now end by this September. The decision points to inventory builds into early 2026 and a softer price environment that could linger until late next year, reinforcing a cautious stance on activity and growth.
The latest OPEC+ Monthly Oil Market Report (MOMR) is similar to EIA’s view. The MOMR shows US production averaging 13.2 MMb/d in 2026. OPEC+ frames its outlook around sustained capital discipline, incremental efficiency gains, weaker drilling momentum, and rising associated gas in key shale plays.
In contrast to the pessimism from EIA/OPEC+, East Daley doesn’t expect production to roll over next year. In the Crude Hub Model, we estimate US crude oil production will average 13.6 MMb/d in 2026, peaking at 13.7 MMb/d in Dec ’26. We base our forecast on the latest NYMEX WTI forward strip.
Even assuming EIA’s price call is accurate, we wouldn’t expect oil production to decline so sharply. We plugged the EIA price forecast into our Production Scenario Tool and estimate US operators would shed ~40 oil-directed rigs through 2026. Operators would cut 28 rigs from the Permian based on the EIA forecast, plus additional cuts from basins such as the Eagle Ford and Bakken. The Permian generates most US supply growth and therefore carries the heaviest downside leverage if WTI weakens. A reduction of 40 rigs from major oil basins would shed ~366 Mb/d by Dec ’26 in the East Daley model.
Early 2026 guidance from leading producers ExxonMobil (XOM), Chevron (CVX) and ConocoPhillips (COP) points to steady production growth, diverging from EIA’s forecast. The higher WTI futures curve suggests traders are discounting the OPEC+ decision to unwind its production cuts. We will continue to monitor price fluctuations and adjust our models accordingly.
Supply & Demand
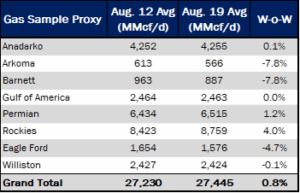
The US natural gas pipeline sample, a proxy for change in oil production, increased 0.8% W-o-W across all liquids-focused basins. Samples decreased 7.9% in the Barnett and 4.7% in the Eagle Ford. The decreases were offset by increases of 4.0% in the Rockies and 1.3% in the Permian. The Rockies and the Gulf of America have a high correlation between gas volumes and crude oil volumes, whereas the Permian and Eagle Ford basins correlation is less than 45%.
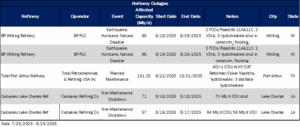
As of August 25, there was ~735 Mb/d of refining capacity offline, including downtime for planned and unplanned maintenance. The Total Port Arthur Refinery accounts for ~151 Mb/d capacity offline due to planned maintenance lasting till 10/21/2025.
Vessel traffic monitored by EDA along the Gulf Coast decreased W-o-W. There were 21 vessels loaded for the week ending August 22 and 24 the prior week.
Regulatory and Tariffs:
Presented by ARBO
Tariffs:
Gray Oak Pipeline, LLC: Certain available capacity discounts were increased.
Magellan Pipeline Company, L.P.: The tariffs were revised to add a new product and to update the product grade document to be consistent with ONEOK’s product grade documents.
The above information is provided by ARBO’s Oil Pipeline Tariff Monitor. For more information on regulatory proceedings or tariff rates, please contact please contact Corey Brill via email at [email protected] or phone at 202-505-5296. https://www.goarbo.com/

