


Executive Summary:
Rigs: The total US rig count decreased during the week of Sept. 14 to 527.
Infrastructure: Permian Gas Dreams Face Crude Hurdles
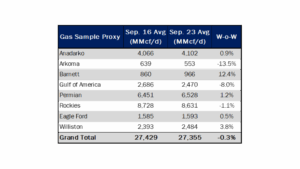
Supply & Demand: The US natural gas pipeline sample, a proxy for change in oil production, decreased 0.3% W-o-W across liquids-focused basins.
Rigs:
- The total US rig count decreased during the week of Sept. 14 to 527. Liquids-driven basins increased 2 rigs W-o-W from 407 to 409.
- Permian:
- Delaware (-3): Mewbourne Oil, Petro-Hunt, Petroplex Energy
- Midland (2): Petroplex Energy, Walter Oil & Gas
- Anadarko (-1): OGP Operating
- Eagle Ford (+3): Kimmeridge Texas Gas, Tidal Petroleum
- DJ (+1): Bison Operating
- Permian:

Infrastructure:
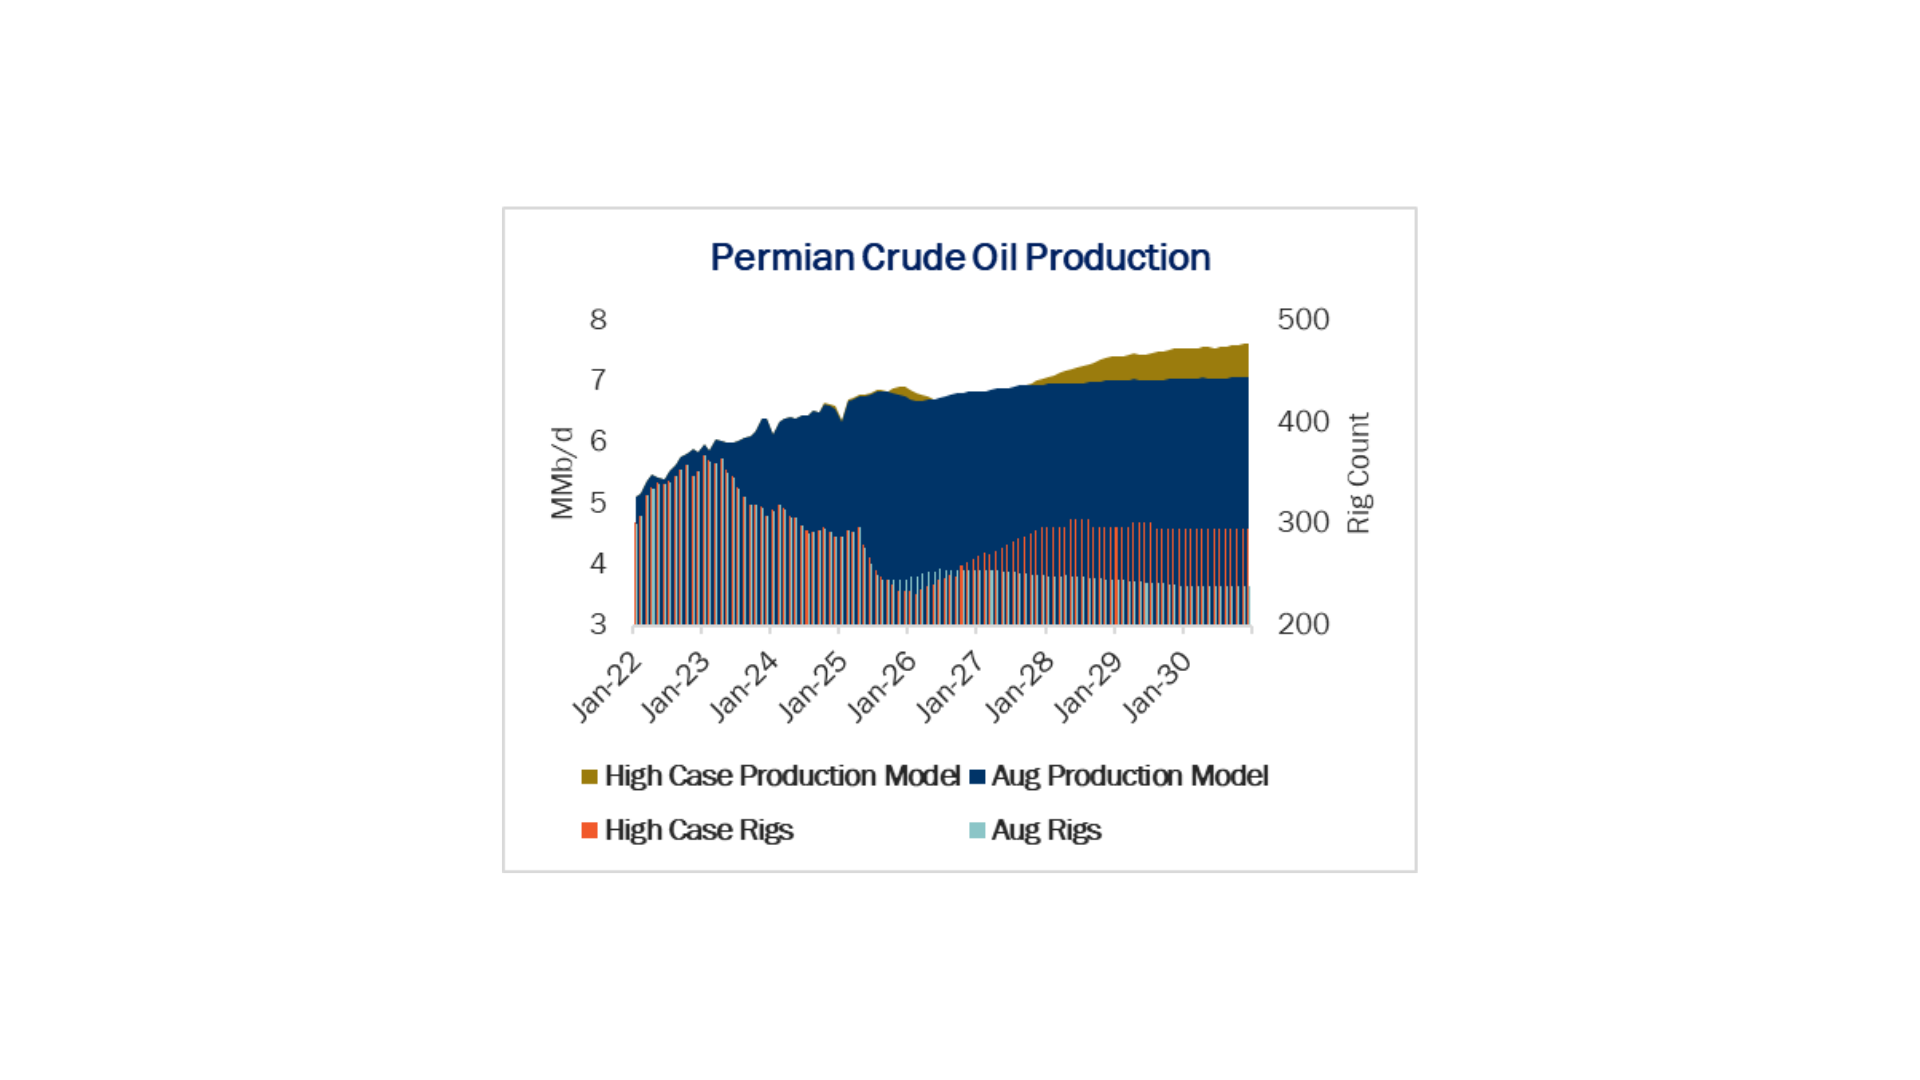
With market attention fixed on the Permian Basin, questions continue to surface about the trajectory of future production. East Daley Analytics’ Production Scenario Tool (PST) provides a detailed view of historical trends and forward-looking forecasts across the basin.
Permian oil production in 2024 averaged 6.44 MMb/d, with 2025 output expected to reach 6.73 MMb/d, a Y-o-Y increase of 292 Mb/d (4.5%). From 2025-30, East Daley forecasts production will grow an additional 4.7%. On the gas side, Permian residue production averaged 18.6 Bcf/d in 2024, and we expect supply will rise to 20.9 Bcf/d in 2025, or ~12% growth Y-o-Y. Between 2025 and 2030, residue gas volumes climb another 4 Bcf/d on average in our outlook as associated gas continues to expand alongside oil. In our base case, eastbound egress is expected to operate at ~83% utilization, westbound flows remain full, Mexican exports are demand-constrained, and northbound flows decline sharply.
This month, we used the PST to test a high-case scenario that assumes newly sanctioned Permian gas pipelines with a final investment decision (FID) run near 90% utilization. Under this scenario, Permian gas production grows nearly 8 Bcf/d from 2025–30 (average to average). Achieving this growth pace would require rigs to increase to 295 by YE30, up from ~249 in August 2025 (see chart).
However, while cheap Permian gas is essential to meet nearly 17 Bcf/d of incremental LNG demand, this growth path creates major problems for crude egress. With volumes to Corpus Christi already near capacity, additional barrels are forced onto Cushing and Houston routes in the Crude Hub Model, pushing those systems to near-full utilization. By YE29, Plains All American’s (PAA) Basin and Sunrise pipelines return to pre-COVID throughput, Enterprise Products’ (EPD) Midland-to-ECHO I and III average 106% utilization, and Energy Transfer’s (ET) West Texas Gulf runs at ~97%.
To be clear, East Daley views this crude scenario as highly unlikely. Current oil prices don’t support the drilling escalation required to achieve it, while local demand remains steady — meaning incremental barrels must find a home overseas. The Energy Information Administration’s (EIA) Short-Term Energy Outlook expects global demand to rise only 2.2 MMb/d from 2024–26, leaving limited room for US shale growth as OPEC+ supply returns. The EIA also projects persistently weak WTI prices through 2026.
It is often easier to rule out what won’t happen than to pinpoint exactly what will. What we can say: unchecked gas growth at current gas-to-oil ratios (GORs) is untenable given crude infrastructure and downstream demand constraints. Yet these new pipelines will not sit idle — the pull from LNG and data centers, exceeding 20 Bcf/d of incremental demand, is too strong.
Bottom line: The Permian is at a crossroads. Crude appears to be nearing its structural limits, while natural gas is pushing for new market share. For both commodities to thrive, producers may need to pivot rigs toward gassier acreage, maximizing GORs to fill gas pipelines without overwhelming crude infrastructure. Clients can access East Daley’s Production Models on Energy Data Studio to run scenario analysis.
Supply and Demand
The US natural gas pipeline sample, a proxy for change in oil production, decreased 0.3% W-o-W across all liquids-focused basins. The Barnett sample increased 12.4% and the Williston increased 3.8%. Those gains were offset by decreases in the Arkoma and Gulf of America by 13.5% and 8%. The Rockies and the Gulf of America have a high correlation between gas volumes and crude oil volumes, whereas the Permian and Eagle Ford basins correlation is less than 45%.
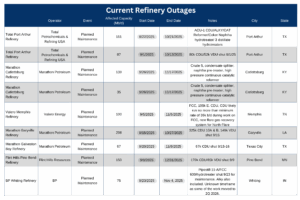
As of Sept. 29, there is currently ~1,102 Mb/d of refining capacity offline for planned maintenance. The Flint Hills Pine Bend refinery accounts for 150 Mb/d of the offline capacity due to planned maintenance lasting until Dec. 31.
Vessel traffic monitored by EDA along the Gulf Coast decreased W-o-W. There were 20 vessels loaded for the week ending Sept. 27 and 26 the prior week.
Regulatory and Tariffs:
Presented by ARBO
Tariffs:
Gray Oak Pipeline, LLC: Certain available capacity discounts were increased.
Magellan Pipeline Company, L.P.: The tariffs were revised to add a new product and to update the product grade document to be consistent with ONEOK’s product grade documents.
The above information is provided by ARBO’s Oil Pipeline Tariff Monitor. For more information on regulatory proceedings or tariff rates, please contact please contact Corey Brill via email at [email protected] or phone at 202-505-5296. https://www.goarbo.com/