


Executive Summary:
Infrastructure: Williams has started service on the 1.8 Bcf/d Louisiana Energy Gateway, ushering in the next growth phase for the Haynesville
Rigs: The US rig count dropped 4 rigs for the July 19 week to 523.
Flows: US natural gas volumes averaged 70.5 Bcf/d in pipeline samples for the week ending July 27, down 0.2% W-o-W from 70.7 Bcf/d the previous week.
Storage: Traders expect the EIA to report a 33 Bcf injection for the week ending July 24.
Infrastructure:
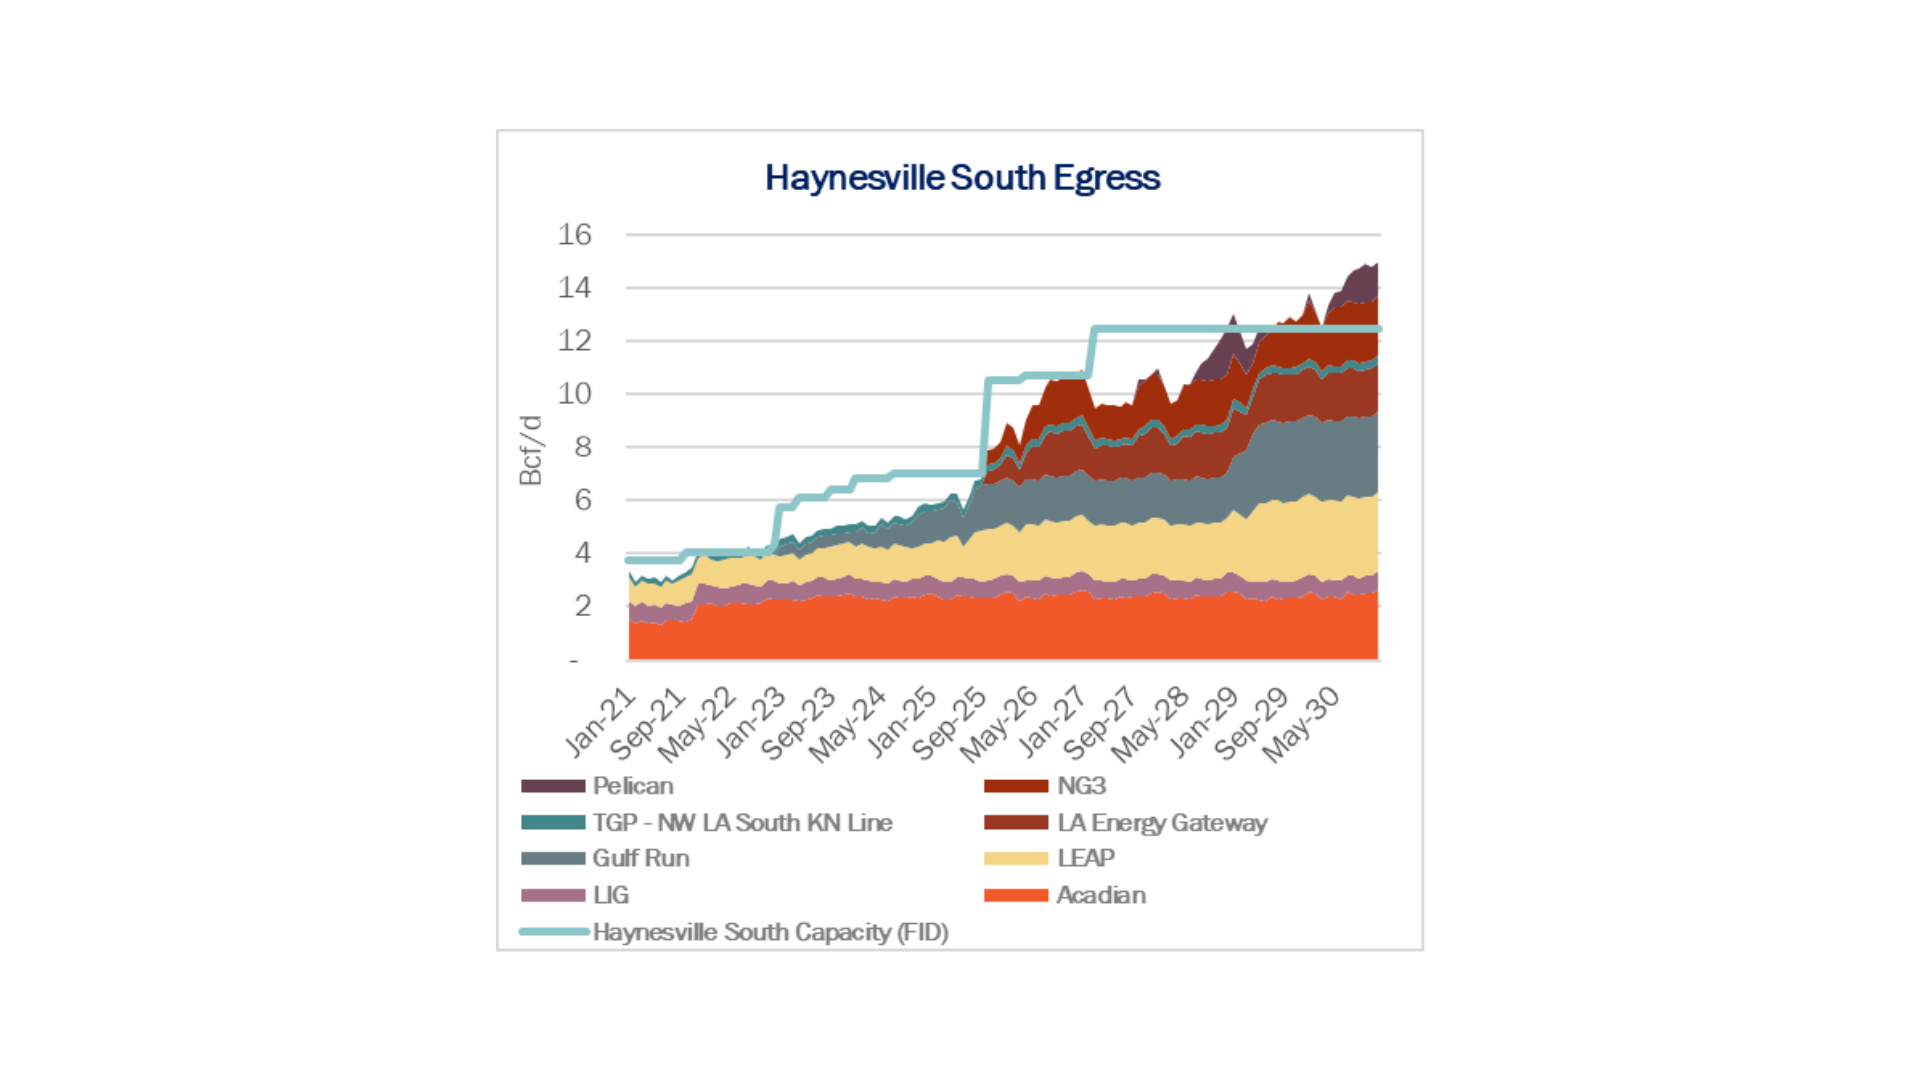
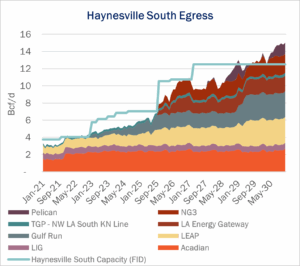
Williams (WMB) has started service on the 1.8 Bcf/d Louisiana Energy Gateway (LEG) system, ushering in the next growth phase for the Haynesville ahead of new LNG demand on the Louisiana Gulf Coast.
LEG posted initial flows of 75 MMcf/d on Wednesday (July 23) into the Transcontinental (Transco) system in Beauregard Parish, according to pipeline bulletin boards monitored by East Daley. LEG deliveries to Transco increased to 145 MMcf/d on Friday (July 25).
Williams had delayed the LEG in-service date from 4Q24 to 2H25 following a legal dispute with Energy Transfer (ET) over rights-of-way. The project cleared major hurdles last year, including a favorable Louisiana district court ruling in June 2024 and a September ‘24 FERC decision affirming LEG’s status as a state-regulated gathering system.
LEG adds critical egress relief to the south, providing headroom at a time when regional LNG demand is accelerating. Flows from the Haynesville to the Louisiana Gulf Coast averaged about 5.7 Bcf/d through June 2025, according to East Daley’s latest Southeast Gulf Supply & Demand Forecast, with the corridor operating near 89% utilization during April and May.
We expect to see flows steadily ramp on LEG, and the system to run full by next summer. The June forecast assumed an October ’25 in-service for modeling purposes, but the pipeline entered service on the earlier side of WMB’s guidance. This update will be incorporated in East Daley’s July S&D report.
New demand is being driven in part by Venture Global (VG), which has started producing LNG from Phase 2 of its Plaquemines terminal in southeastern Louisiana. The facility has averaged 2.68 Bcf/d of feedgas in July as Phase 2 starts up.
The Plaquemines ramp highlights LEG’s well-timed startup, which lowers near-term egress risk from the Haynesville and should ease basis pressure on East Texas markets like NGPL-TXOK. As Plaquemines ramps toward its full capacity of ~3.6 Bcf/d, LEG will be critical in supporting future LNG demand growth in the region.
We continue to monitor timing for Momentum Midstream’s NG3 pipeline, expected online later in 2H25, which would provide additional egress capacity as Plaquemines and other terminals scale toward full output through 2026.
Rigs:
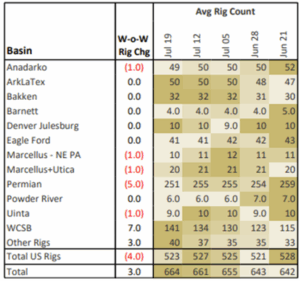
The US rig count dropped 4 rigs for the July 19 week to 523. The Permian (-5), Anadarko (-1) and Appalachia (-2) lost rigs. Several smaller basins gained rigs, including the Green River and Powder River, while other basins remained flat W-o-W.
On the midstream side, Targa Resources (TRGP) is down 2 rigs net with losses on its Permian and Eagle Ford systems. Western Midstream (WES) is up 2 rigs total with gains on its Permian systems. See East Daley’s weekly Rig Activity Tracker for more information on rigs by basin and company.
Flows:
US natural gas volumes averaged 70.5 Bcf/d in pipeline samples for the week ending July 27, down 0.2% W-o-W from 70.7 Bcf/d the previous week.
Gas basins were unchanged at a 44.1 Bcf/d average. The Haynesville sample declined 0.7% to 11.0 Bcf/d. The Bakken sample increased 2.7% to 2.5 Bcf/d, while the DJ rose 1.3% to 2.8 Bcf/d.
Storage:
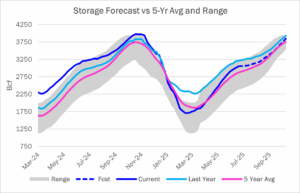
Traders and analysts expect the Energy Information Administration (EIA) to report a 33 Bcf injection for the week ending July 24. A 33 Bcf injection would increase the surplus to the five-year average by 9 Bcf to 180 Bcf. The storage deficit to last year would drop 15 Bcf to 138 Bcf.
The question East Daley asked last week remains – is summer over? Based on weather, the answer is not just yet. Through mid-August (the next four weekly surveys), we expect a little over 100 Bcf in total injections. This would bring storage inventories to 3,180 Bcf, or 165 Bcf higher than the five-year average. Following that, 11 weeks remain in the traditional injection season through the end of October. With summer heat typically receding after mid-August, we will have a clearer picture of where inventories are headed.
We expect inventories at the end of October to finish at 3,849 Bcf – that means the average storage injection for the next 15 weeks would be around 52 Bcf per week. The five-year average injection over the same period is 55 Bcf per week.
See East Daley Analytics’ latest Macro Supply & Demand Report for more analysis on the storage outlook.
Calendar:

Subscribe to East Daley’s The Daley Note (TDN) for midstream insights delivered daily to your inbox. The Daley Note covers news, commodity prices, security prices, and EDA research likely to affect markets in the short term.