


Executive Summary:
Infrastructure: Rapid data center development has sparked a consumer backlash, causing cancellations and delays for some projects.
Rigs: The US lost 2 rigs for the week ending Oct. 4, bringing the total rig count to 529.
Flows: US natural gas volumes averaged 68.9 Bcf/d in pipeline samples for the week ending Oct. 12, down 0.7% W-o-W.
Storage: Traders expect the EIA to report a 79 Bcf injection for the week ending Oct. 10.
Infrastructure:
The surge in US data center development has boomeranged on the industry in the form of a consumer backlash, driven by concerns over land use and higher utility bills. The revolt is causing project cancellations and putting at risk potential growth in natural gas demand.
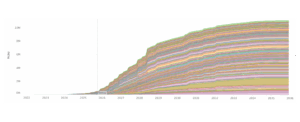
In the Data Center Demand Tracker, East Daley Analytics is tracking more than 500 announced data center projects nationwide, representing over 200 GW of potential electric load (see map below). Of these, nearly 400 projects are under construction or still planned. The boom is emerging as a structural driver of gas demand, reshaping regional load profiles and reinforcing the need for new generation capacity. If developers built all ~400 pending data center projects, East Daley estimates they would require over 15 Bcf/d of natural gas (see adjusted demand figure below from the Data Center Demand Tracker).
But even as announcements surge, cancellations and delays are piling up. The gap is widening between headline projects and what industry will actually build. We estimate opposition has put more than 7 GW of data center capacity at risk in the last several months from projects paused, denied permits or tied up in legal disputes.
The backlash stems from three main forces: community and political pushback, slower corporate pacing amid oversupply, and infrastructure constraints that limit new gas plants and pipelines.
Local resistance is the most visible challenge. Residents cite concerns over land use, environmental impacts, quality of life, and higher electric and water bills. Communities worry about noise from cooling equipment, constant lighting, heavy water use and the industrialization of farmland.
Multiple projects have hit roadblocks. In Wake County, NC, residents mobilized against the 250 MW New Hill Digital Campus, arguing it would double the regional power load and drive up electricity costs. In Monroe County, GA, commissioners rejected the 1.2 GW Bolingbroke campus after weeks of public protests, calling it the “will of the people.” And in Fauquier County, VA, local regulators recommended denial of the proposed 800 MW Gigaland project over water quality and rural character concerns.
Some setbacks are self-imposed. Hyperscale operators are strategically aligning their expansion with market demand to prevent excess capacity development. Microsoft (MSFT) paused its $1B Central Ohio campus, part of a broader decision to defer as much as 2 GW globally. The company already added record capacity in 2024 and is balancing expansion against near-term AI and cloud forecasts.
Data centers ultimately run on the power grid, and in most regions gas-fired power plants support the new load, making natural gas the critical fuel for growth. But that dependency exposes infrastructure and resource risks. New gas plants for large campuses often face years of delay due to permitting and approvals. Those plants in turn rely on interstate pipelines to move supply from producing basins to demand hubs.

Meeting the massive load from data centers will require new infrastructure and pipeline capacity, as many existing systems are already stretched. Nowhere is this more visible than in Northern Virginia’s “Data Center Alley.” Growth there has collided with hard limits: developers have canceled at least six projects, and PJM, the regional transmission operator, has warned that future developments may need onsite generation because the grid cannot deliver additional gas-fired power. Williams (WMB) has proposed the Power Express expansion on the Transcontinental pipeline to handle the new load.
The retrenchment comes as no surprise to East Daley. We have consistently limited our demand estimate from the emerging data center sector given constraints on pipeline capacity and long queues for turbines and transmission tie-ins. In the Macro Supply & Demand Forecast, we currently estimate 4.8 Bcf/d of new demand by 2030, far short of the 15 Bcf/d potential.
The US data center boom is real, but so is the backlash. Communities argue they bear the costs while gaining limited long-term benefits, and even hyperscale operators are pacing growth selectively. New gas plants and pipeline capacity will be critical to support massive loads, and many systems already face constraints. The upside case of 15 Bcf/d remains possible, but growth will be lumpy, contested and regionally uneven.
Follow data center projects with East Daley’s Data Center Demand Tracker, and the impacts to US gas markets in the Macro Supply & Demand Forecast.
Rigs:
The US lost 2 rigs for the week of Oct. 04, bringing the total rig count to 529. The Eagle Ford (-3), Permian (-2) and Marcellus+Utica (-1) lost rigs while the Barnett (+2) and Anadarko (+1) gained rigs W-o-W.
At the company level, TRGP (-3), WES (-3), PSX (-1), WMB (-1), Brazos Midstream (-1) and OXY (-1) lost rigs while KNTK (+3), ENLC (+2), ET (+1), EPD (+1), KMI (+1) and OKE (+1) gained rigs W-o-W.
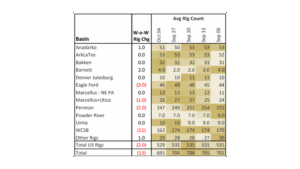
See East Daley Analytics’ weekly Rig Activity Tracker for more information on rigs by basin and company.
Flows:
US natural gas volumes averaged 68.9 Bcf/d in pipeline samples for the week ending Oct. 12, down 0.7% W-o-W.
Major gas basin samples decreased 1.0% W-o-W to 42.3 Bcf/d. The Haynesville sample declined 1.9% to 9.9 Bcf/d, while the Marcellus+Utica sample decreased 0.8% to 31.5 Bcf/d.
Samples in liquids-focused basins declined 0.5% W-o-W to 18.8 Bcf/d. The Permian sample fell 2.8% to 6.1 Bcf/d, while the Anadarko sample increased 1.1%.
 Storage:
Traders and analysts expect the Energy Information Administration (EIA) to report a net injection of 79 Bcf for the week ending Oct. 10.
A 79 Bcf injection would decrease the surplus to the five-year average by 4 Bcf to 153 Bcf. This would be the third week in a row that the surplus has dropped. The storage surplus to last year would increase by 2 Bcf to 25 Bcf.
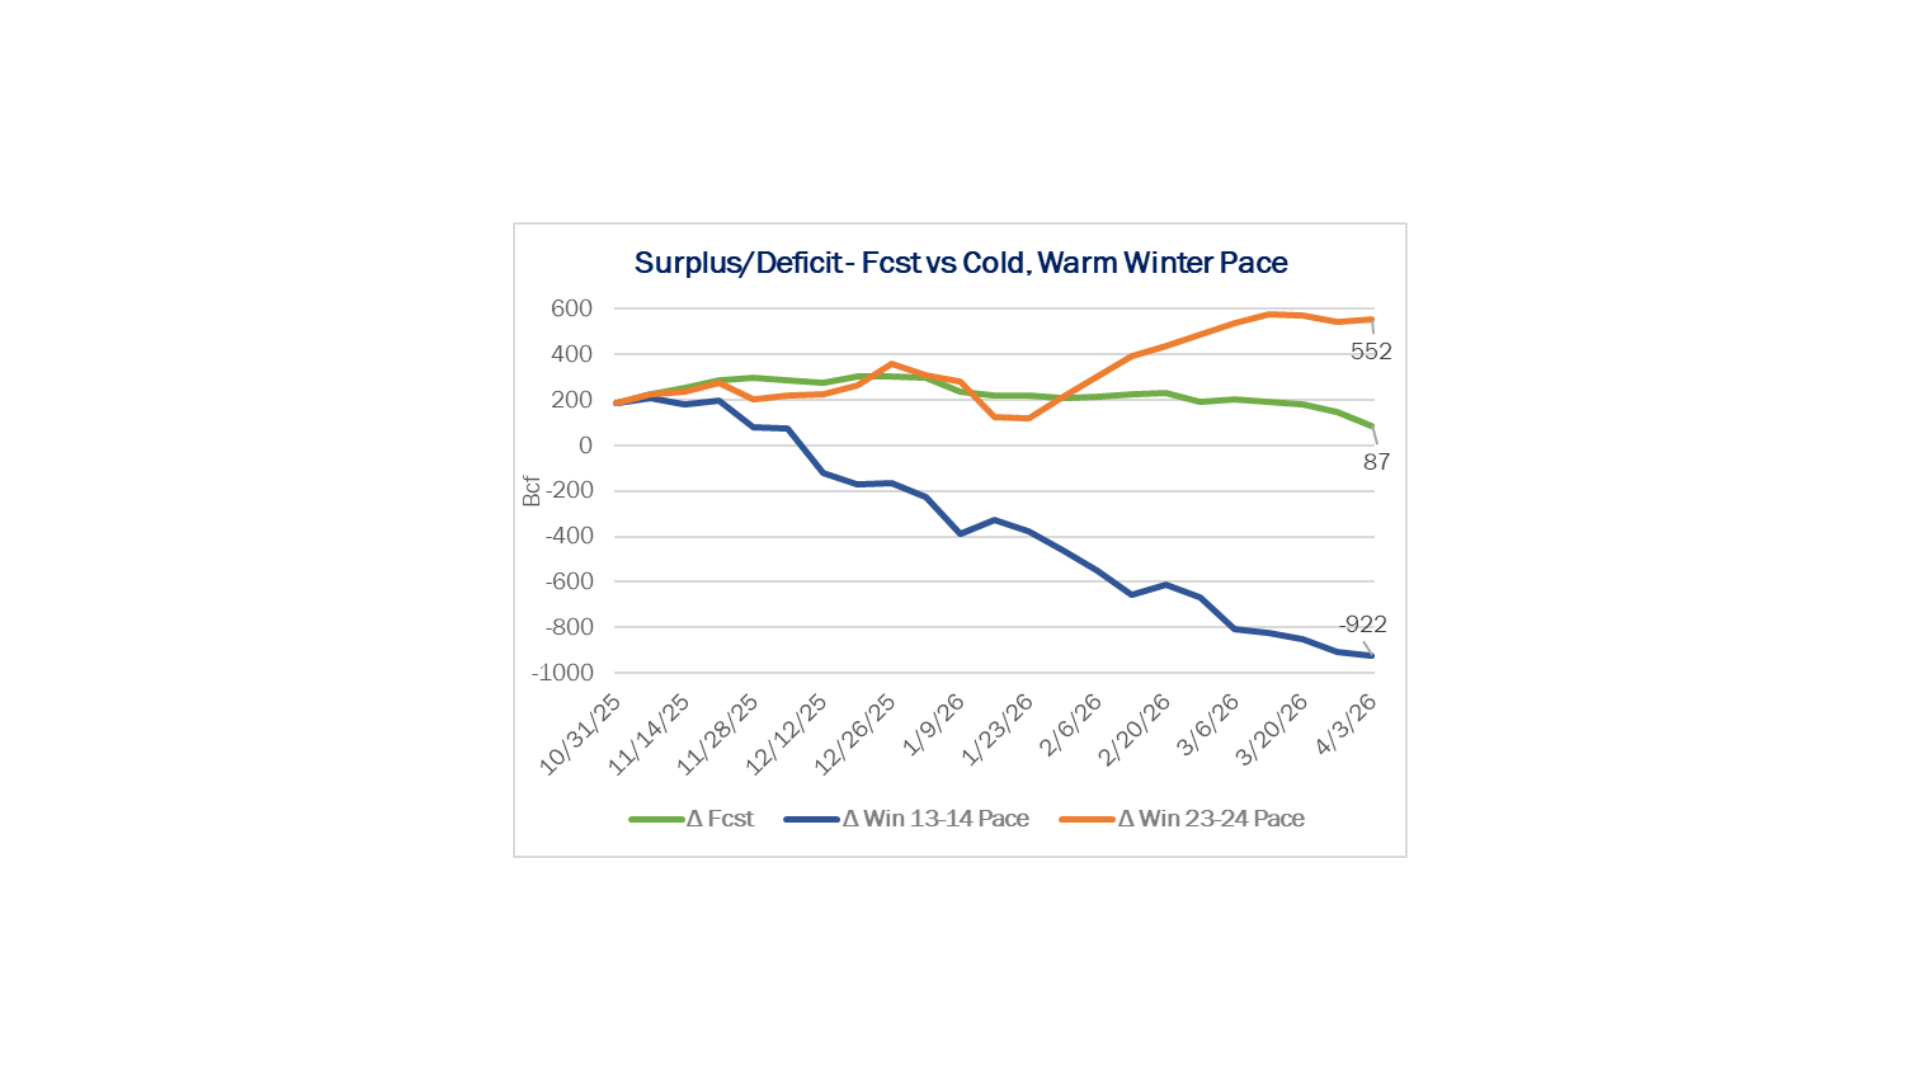
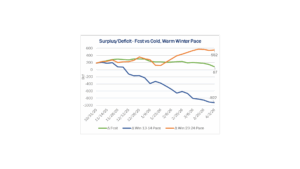
Winter is just around the corner, and the pace of withdrawals during the heating season is top of mind. Will the Lower 48 have a cold, warm or average winter? The chart below shows the implications of each scenario on storage.
A cold winter like 2013-14 would send inventories at the end of March 2026 to a staggering 922 Bcf below the five-year average without a production response. However, this scenario leads to very high prices that would solicit a supply response rather quickly. If the winter is warm, storage would build to a surplus of over 550 Bcf. Gas prices would be crushed as a result, and producers would throttle production back, similar to what occurred in February and March 2024. Our base case forecast shows inventories finishing at around 90 Bcf surplus to the five-year average, which results in slightly stronger prices than the current strip.
Our scenario estimates are meant to be guardrails around what could happen given the weather. Regardless of how the winter unfolds, there is bound to be more volatility ahead in the near term. See the latest Macro Supply & Demand Report for more analysis on storage and the winter market outlook.
Calendar:

Subscribe to East Daley’s The Daley Note (TDN) for midstream insights delivered daily to your inbox. The Daley Note covers news, commodity prices, security prices, and EDA research likely to affect markets in the short term.