



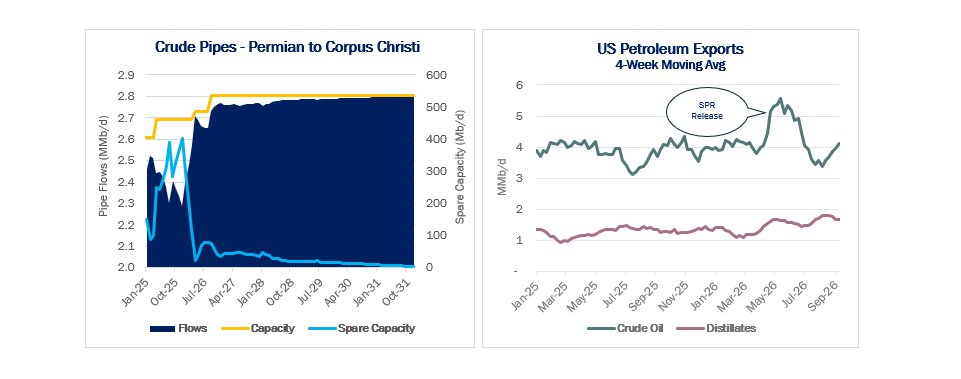
Crude oil prices have surged past $100/bbl on fresh supply disruptions in the Middle East. It’s a scenario that typically calls on more US barrels as the market’s fallback plan, but infrastructure constraints may limit how much more US crude oil reaches the market.
The WTI October contract pushed past $100/bbl on Sept. 9 after the Houthi tribe advanced along Yemen’s Red Sea coast and launched drone attacks that damaged Saudi Arabia’s East-West Pipeline. The Houthis also captured the island of Mayun at the entrance to the Red Sea, positioning the rebel group to threaten shipping through the Bab el-Mandeb Strait.
WTI traded over $100 for eight consecutive days. Prices have eased somewhat after Saudi Arabia said Tuesday it would restore some flows through the East-West line. The October contract traded around $92.75/bbl late afternoon Wednesday (Sept. 23).
The East-West Pipeline has been the Saudis’ main workaround to keep crude exports flowing after Iran closed most traffic through the Strait of Hormuz. The pipeline normally moves 4–5 MMb/d but has been shut down entirely. Full repairs are likely to take four to six weeks to complete.
The disruption to the East-West line means both of the Persian Gulf’s major release valves are constrained. The Strait of Hormuz, which historically has carried ~20 MMb/d, is now moving about 4.9 MMb/d, Forbes reports. The Houthis’ advance also puts exports through Saudi Arabia’s Yanbu port on the Red Sea at risk.
Persian Gulf shut-ins averaged 6.7 MMb/d in August, up from 5.0 MMb/d in July, according to the Energy Information Administration (EIA). The EIA expects shut-ins to remain above 5.5 MMb/d and average 5.7 MMb/d through 4Q26, while the International Energy Agency (IEA) has pushed its forecast for a full Persian Gulf recovery into 2027.
Pipe, Dock Constraints Cap Upside
The US oil industry normally steps up in response to higher prices, ramping drilling and moving more barrels to export docks. But infrastructure constraints are likely to limit upside this cycle.
Pipelines are the primary bottleneck. Permian-to-Gulf Coast crude pipes are already operating at ~95% utilization toward Corpus Christi and 90% toward Houston and Nederland, according to East Daley Analytics’ Crude Hub Model. Throughput was elevated along these routes even before the Iran conflict caused oil prices to jump; we estimate only about 500 Mb/d of combined spare capacity currently on Houston- and Corpus Christi-bound Permian oil pipes. Moreover, these systems have very few incremental expansion opportunities that can be brought online quickly.
Export docks in Corpus Christi and Houston appear to have more leeway to load additional barrels, running at 47% and 33% utilization, respectively. However, the aggregate numbers mask what’s happening at individual docks, particularly those that handle both crude and refined products out of shared infrastructure. For example, Buckeye Partners’ Texas Hub in Corpus Christi is operating at roughly 86% utilization, because it’s splitting capacity between crude oil and products rather than running crude only. Many docks are also located in shallow waters and can’t directly load the very large crude carriers (VLCCs) favored for long-haul crude routes. Exporters must use reverse lightering on smaller tankers at these docks, an obstacle to ramping capacity.
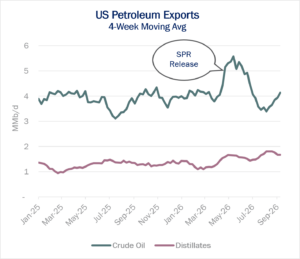 Export data shows the constraints. US crude oil exports surged in the spring, passing 5.5 MMb/d in May vs ~4 MMb/d before the Iran war, according to EIA data. But nearly all the gains came from an emergency release from the Strategic Petroleum Reserve (SPR). Without the temporary SPR fillip, crude exports have reverted back to the 4 MMb/d level that prevailed prior to the Middle East conflict (see figure).
Distillate exports have ramped in response to soaring global diesel prices, reaching 1.7 MMb/d in September vs the 1.3-1.4 MMb/d level at the start of the year. But these exports also have a ceiling. Gulf Coast refineries are operating at ~87–90% utilization, limiting how quickly incremental crude can be converted into gasoline, diesel or jet fuel.
The US industry can respond, but it will take time to expand infrastructure. The prevailing 5-6 MMb/d global supply gap is far larger than what can be closed now. If Middle East disruption extends into 2027, the industry will need to look where additional pipeline, refining and dock capacity can realistically be added. – Maria Paz Urdaneta.
Can Crude and NGL Markets Keep Pace with the US LNG Boom?
Rising US LNG feedgas demand has the potential to float all boats — but only if crude oil and NGL markets can support the growth.
Reaching nearly 26 Bcf/d of LNG feedgas demand by the end of 2027 will require producers to drill aggressively across the Permian, Haynesville and Northeast. In the Permian especially, that growth depends on steadier crude prices, to give producers the confidence to commit capital, subscribe to new pipeline capacity and fill the infrastructure midstream companies must build.
Join East Daley Analytics on Wednesday, Sept. 30 as we examine the cross-commodity conditions required to keep the LNG growth story on track:
- What crude price environment will support sustained drilling and pipeline investment?
- Could Permian crude constraints limit associated gas production?
- Where could NGL processing, takeaway and export bottlenecks emerge?
- Which companies are best positioned to capitalize?
LNG demand may be the rising tide — but crude and NGL markets will determine whether all boats can rise with it.
Join East Daley Analytics on Sept. 30 at 10:00 am MT for a discussion at the intersection of energy. Click here to reserve your spot today.
One Market, One Model: Gain a Holistic View of North America Supply & Demand
East Daley Analytics is pleased to announce the Canada Supply & Demand report. The Canada S&D completes our North American model, providing a fully integrated supply and demand forecast for crude oil and natural gas. East Daley follows molecules from Canadian production through US infrastructure to end-markets. Clients now have a continental view to anticipate trends, from how Canadian gas is reshaping Midwest markets, to how crude imports flow to Gulf Coast refiners. The Canada S&D report and dataset is available exclusively in Energy Data Studio. Reach out to learn more about East Daley’s North American energy model.
The Daley Note
Subscribe to The Daley Note for energy insights delivered daily to your inbox. The Daley Note covers news, commodity prices, security prices and EDA research likely to affect markets in the short term.