

Market Movers:
Oil market volatility from the Iran conflict could pump up earnings for South Bow.
Estimated Quarterly Volumes 4Q25 to 1Q26: The Haynesville flow sample is down 0.8% 4Q25 to 1Q26.
Calendar:
Market Movers:
Oil market volatility from the Iran conflict could pump up earnings for South Bow (SOBO). The company’s marketing segment has been pressured by reduced volumes on Keystone Pipeline, but the unit is poised to gain from widening price spreads to the Gulf Coast.
Keystone has been operating under pressure restrictions since April ’25, when the pipeline suffered a rupture in North Dakota. The restrictions have constrained throughput from Western Canada and limited the system’s ability to move barrels beyond committed volumes. As a result, South Bow has primarily focused on meeting contractual obligations, reducing its exposure to higher-margin spot opportunities and weighing on overall marketing performance.
That backdrop may now be shifting. Spreads have widened between WTI and Magellan East Houston (MEH), a primary benchmark for Gulf Coast crude exports. The wider differentials create a more constructive environment for earnings by increasing the value of access to Gulf Coast markets (see figure).
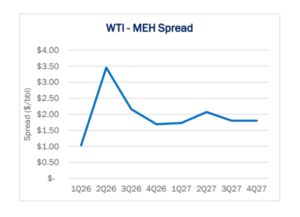
Under normal conditions, the MEH-WTI spread reflects the marginal cost of transporting crude from the Cushing hub in Oklahoma to Houston, averaging about $1.02/bbl in 2025. However, netbacks to the Gulf Coast have strengthened since the start of the Iran war, a result of increased refinery demand and higher export pricing tied to the international Brent benchmark. Global supply disruptions have tightened waterborne crude markets and pulled US barrels toward the coast, pushing the spread above $4 in April.
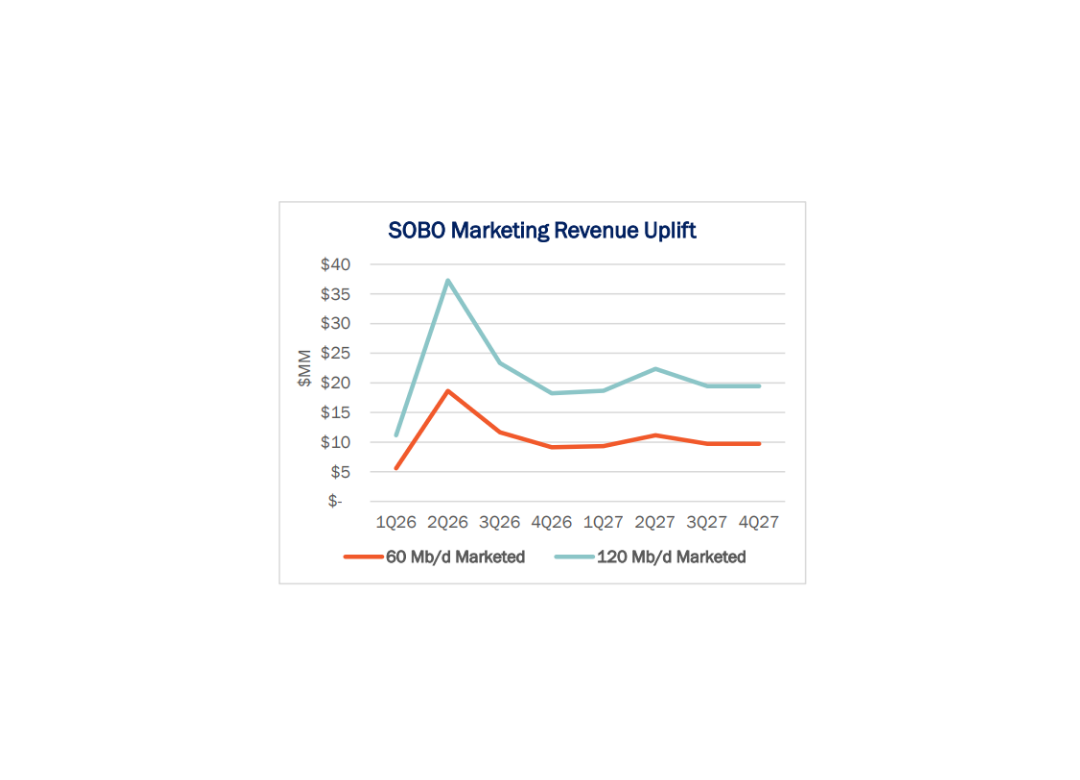
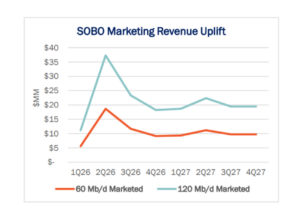
While the marketing segment is somewhat opaque, East Daley Analytics’ SOBO Financial Blueprint provides insight into the potential upside. South Bow’s Cushing-to-Gulf Coast corridor is well positioned to capture this opportunity, with ~120 Mb/d of open capacity available to its marketing arm.
We estimate Keystone’s leg from Cushing to the Gulf Coast could generate $80MM in additional revenue from 2Q26 to YE26 and $80MM in 2027 if all 120 Mb/d of open capacity were utilized (see figure). While the pressure restrictions on Keystone have curtailed imports from Canada, they do not apply to the southern leg of the system.
East Daley views recent volatility as a near-term tailwind that could help South Bow optimize its assets and strengthen its balance sheet.
Estimated Quarterly Volumes
The Total Sample represents the flow sample and plant data accessible to EDA. The latest Q-o-Q percentage change is estimated by comparing either flow sample data Q-o-Q or plants within a basin that have continuously reported inlet volumes from the prior quarter to the current quarter. 1Q26 is expressed as growth from 4Q25 to 1Q26.
The Rockies represents the aggregate of the Big Horn, DJ, Green River, Piceance, Powder River, San Juan, Uinta and Wind River basins.
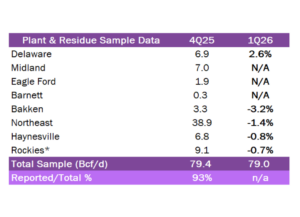
Haynesville: The Haynesville flow sample is down 0.8% 4Q25 to 1Q26. DTM’s Blue Union system is up 1.6% while William’s Louisiana/Magnolia system is down 11.1%. Top producers on Louisiana/Magnolia include Expand Energy (499 MMcf/d), GEP Haynesville II (460 MMcf/d) and Apex Natural Gas (244 MMcf/d).
Northeast: The Northeast flow sample is down 1.4% 4Q25 to 1Q26. MPLX’s Utica system is down 14.7% and DTM’s Susquehanna system is down 10.5% Q-o-Q. The top producers on Susquehanna include Expand Energy (590 MMcf/d), Coterra Energy (111 MMcf/d) and Repsol Oil and Gas (10 MMcf/d).
Calendar: