

Market Movers:
The industry is amid a debate over how much gas demand will ultimately materialize for data centers. Rapid-fire project announcements suggest robust growth ahead, but new infrastructure lags.
Estimated Quarterly Volumes:
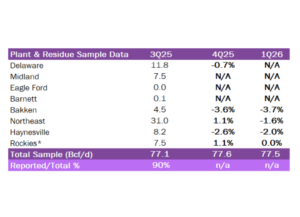
3Q25 to 4Q25: The Bakken (-3.6%), Haynesville (-2.6%) and Delaware (-0.7%) are down while the Northeast (1.1%) and Rockies (1.1%) are up Q-o-Q.
4Q25 to 1Q26: The Bakken (-3.7%), Haynesville (-2.0%), and Northeast (-1.6%) are down while the Rockies (0.0%) are even Q-o-Q.
Calendar: EDA will be in Tulsa March 23-26. The next financial model updates will occur March 20. An earnings review for SMC will be published by March 13.
Market Movers:
The industry is amid a debate over how much gas demand will ultimately materialize for data centers. Rapid-fire project announcements suggest robust growth ahead. For capital markets, the more relevant question is how many data centers will actually be delivered, powered and placed into service, with the gap based on infrastructure constraints.
Using East Daley Analytics’ Data Center Demand Monitor tool in Energy Data Studio, our risk-adjusted forecast points to roughly 10 Bcf/d of natural gas demand by 2030 tied to data center development. We tier developers by quality, discount speculative sponsors, apply haircuts to utilization, and phase construction timelines. It is not a headline figure, but a more realistic estimate of the projects likely to advance.
Now compare that demand forecast to infrastructure. In the same Energy Data Studio framework, we map announced transmission, compression and generation expansions, and see closer to ~5 Bcf/d of credible infrastructure positioned to serve that load over the same time horizon. That leaves an infrastructure gap of ~5 Bcf/d.
This gap is the story. It suggests that many announced data centers will not start on schedule. Some will start in phased tranches. Others will wait for generation, pipeline laterals, or compression to be built. In constrained systems, molecules and megawatts must arrive together. When they don’t, capital is rationed. And rationing creates pricing power.
This gap is where Williams (WMB) is positioning itself as a central actor. WMB is not simply transporting gas; it is integrating supply, transmission and power generation into a coordinated offering.
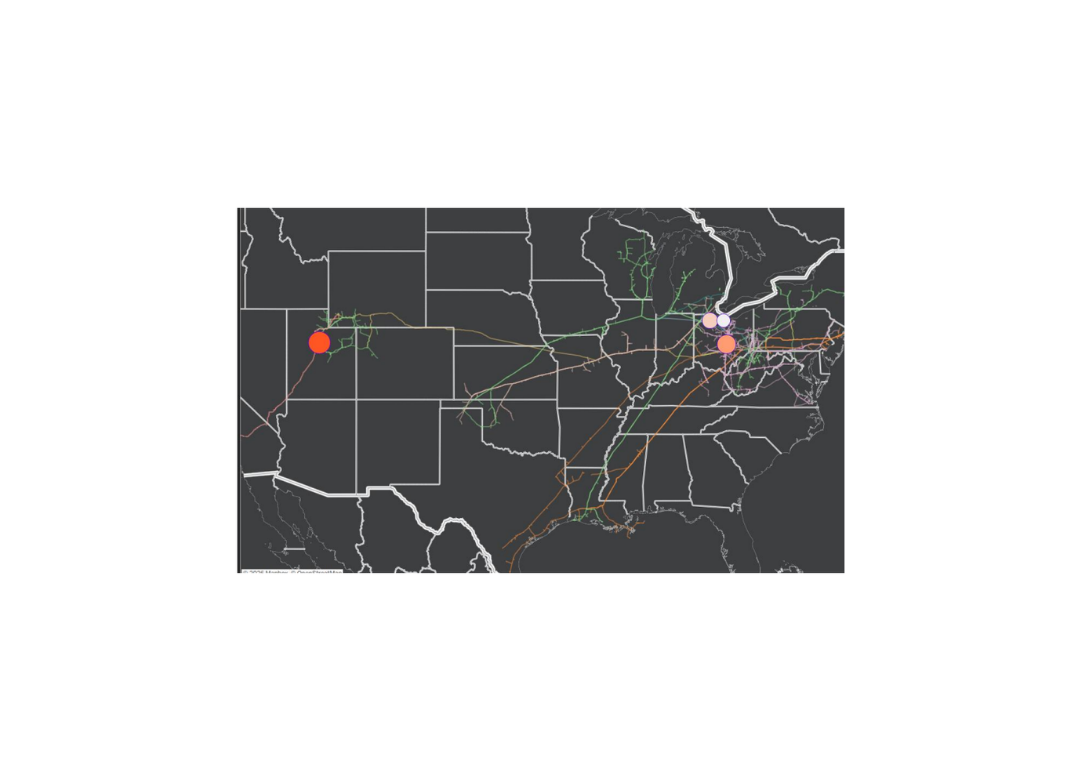
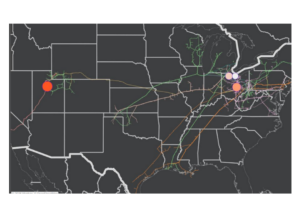
East Daley’s Blueprint Financial model for WMB in Energy Data Studio shows the company currently has over $7B of projects tied to the data center theme, shown in the map below. One of the largest is Project Socrates, a $2.2B project combining gas delivery with 400 MW of power generation for a Meta data center in New Albany, OH.
Williams’ data center investments translate into meaningful earnings leverage: Our model shows ~$1.2B of annual EBITDA uplift by YE27, expanding to ~$1.8B by YE28 on an annual run rate.
That step-up matters. It demonstrates that the bottleneck is real and already being monetized. WMB’s pipeline footprint gives it an edge. The company can move supply from major basins, connect into constrained demand corridors, and layer on generation solutions.
Integration becomes a competitive advantage in a market with synchronization risk. Projects fail if fuel supply and power generation and other infrastructure don’t align. The ability to deliver a bundled solution reduces execution risk for hyperscalers and increases visibility for investors.
The opportunity lies in last-mile pipeline development and targeted infrastructure builds. Laterals, compression upgrades, and metering facilities may not grab headlines, but they unlock volumes. These projects are typically smaller in capital intensity, faster to permit, and capable of generating durable, contracted cash flows when paired with creditworthy demand.
The 10 Bcf/d data center demand wave will not clear evenly, which is why it’s investable. Scarcity shifts economics toward assets that relieve constraints, like WMB’s investments. Projects that can deliver reliability, whether firm transport, generation fuel or electricity supply, will command premium returns.
Estimated Quarterly Volumes
The Total Sample represents the flow sample and plant data accessible to EDA. The latest Q-o-Q percentage change is estimated by comparing either flow sample data Q-o-Q or plants within a basin that have continuously reported inlet volumes from the prior quarter to the current quarter. 4Q25 is expressed as Q-o-Q growth from 3Q25 and 1Q26 is expressed as Q-o-Q growth from 4Q25.
Rockies represents the aggregate of Big Horn, DJ, Green River, Piceance, Powder River, San Juan, Uinta and Wind River basins.
Haynesville: The Haynesville flow sample is down 2% from 4Q25 to 1Q26. Energy Transfer’s ENBL Haynesville system is roughly flat Q-o-Q while the KMI-KinderHawk system is down 1.6% Q-o-Q. Top producers on KinderHawk include Comstock Resources (263 MMcf/d), BP (222 MMcf/d) and Aethon Energy (194 MMcf/d).
Northeast: The Northeast flow sample is down 1.6% from 4Q25 to 1Q26. The EQT-ARO system is down 4.7% Q-o-Q while the MPLX-Mobley system is down 23% Q-o-Q. Top producers on the Mobley include system include EQT (536 MMcf/d) and JAY-BEE O&G (54 MMcf/d).
Calendar: