
Executive Summary:
Infrastructure: Plaquemines LNG is receiving up to 2.7 Bcf/d and creating upward pressure on Southeast gas prices.
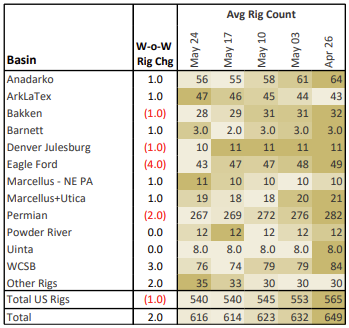
Rigs: The US rig count decreased by 1 for the May 24 week to 540.
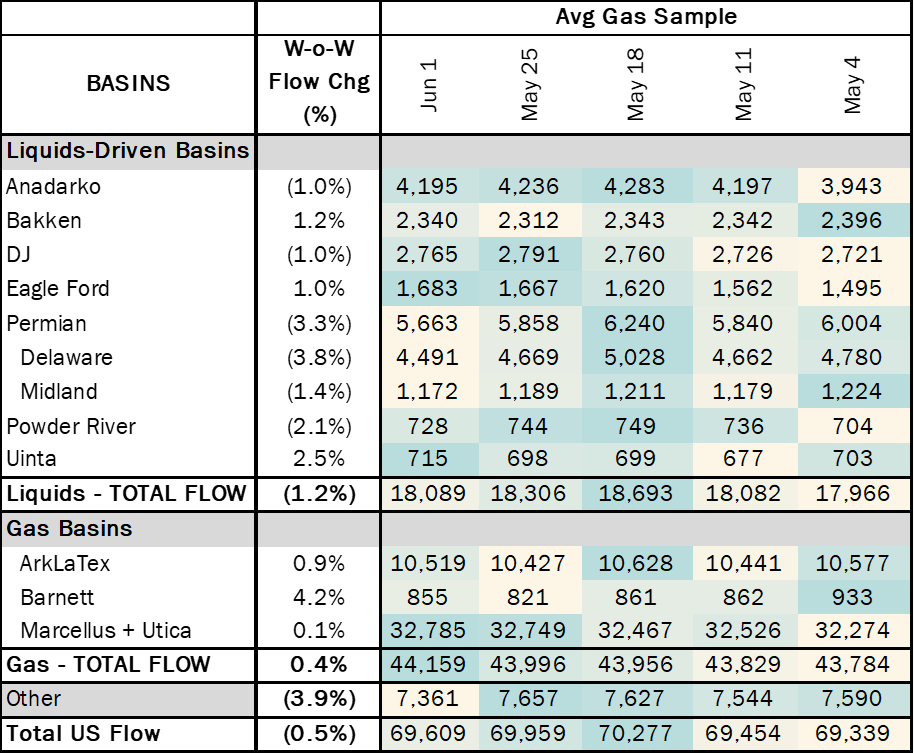
Flows: US natural gas pipeline samples averaged 69.6 Bcf/d for the week ending June 1, down 0.5% W-o-W.
Storage: Traders expect the EIA to report a 111 Bcf injection for the week ending May 30.
Infrastructure:
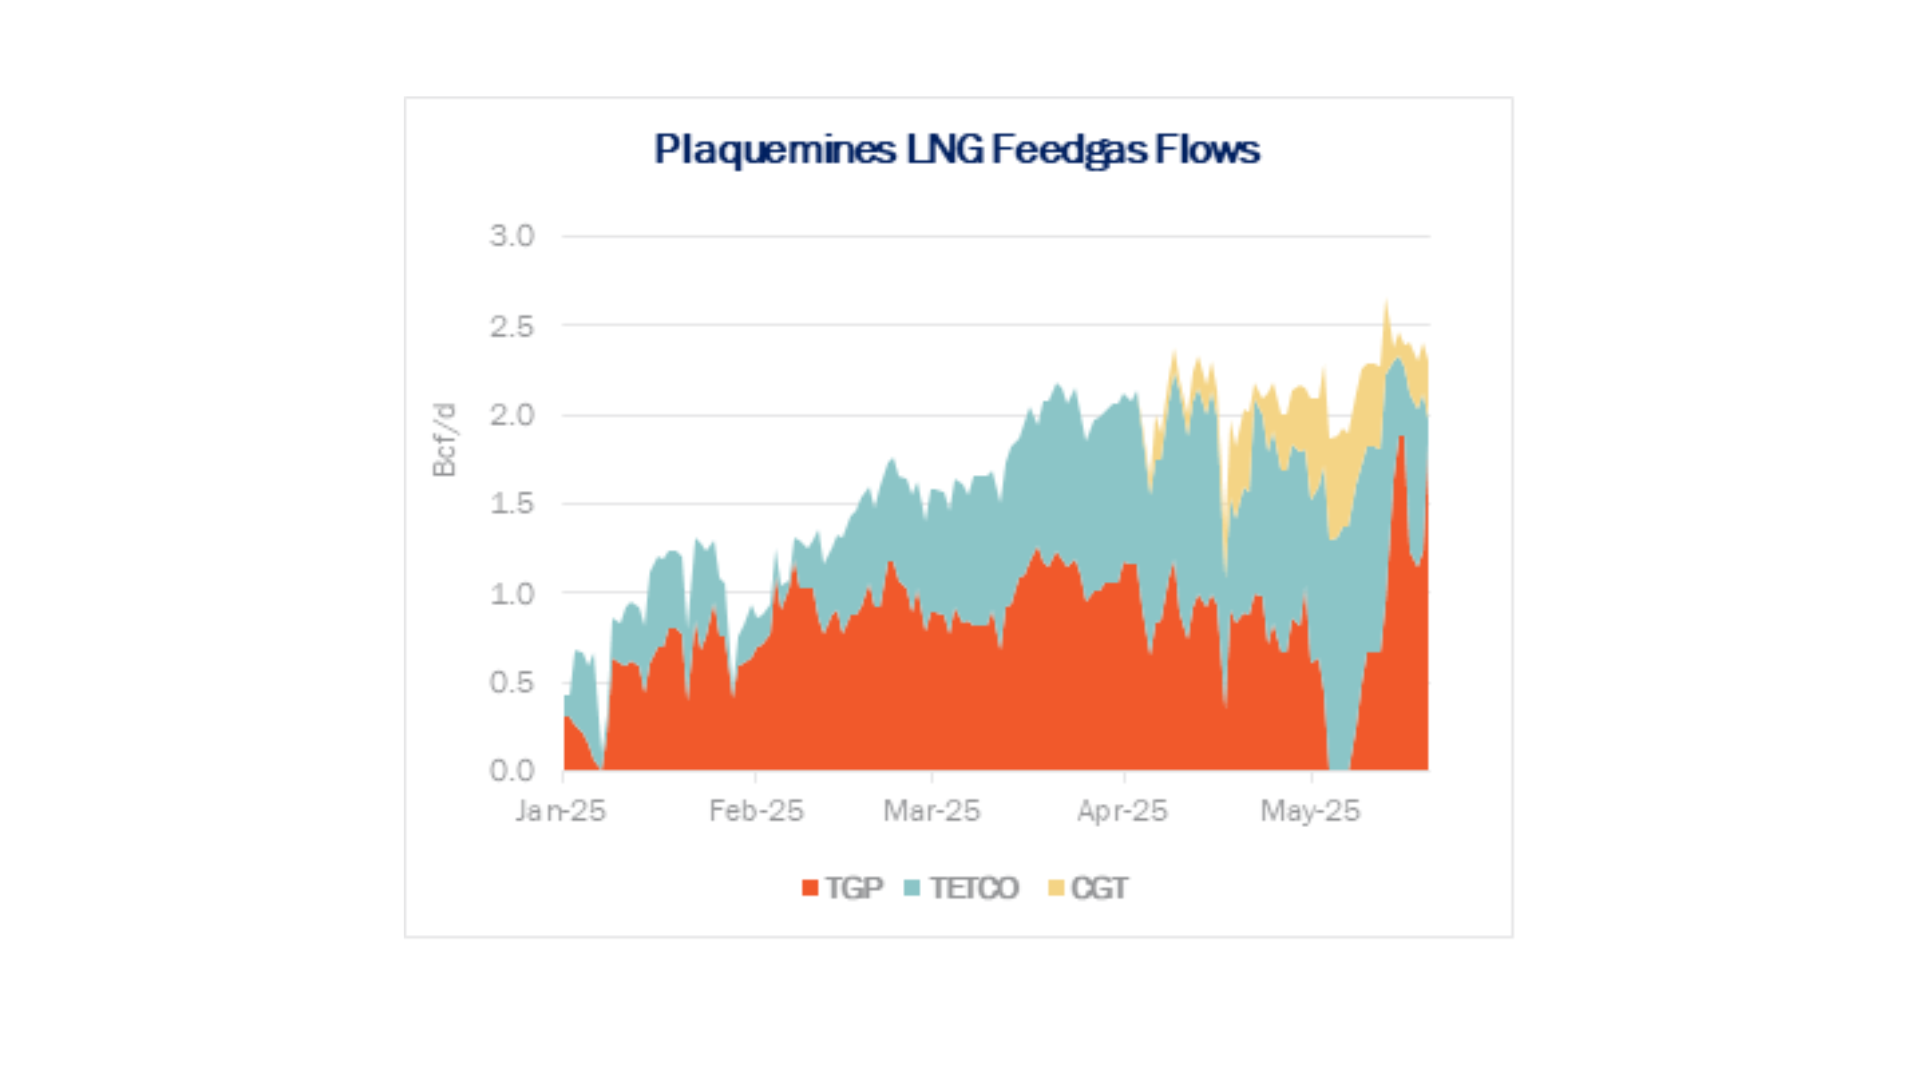
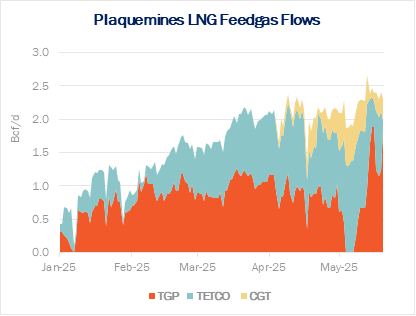
East Daley forecasts the Southeast will be short natural gas in 2026-27 owing to more than 3 Bcf/d of demand pressure from Plaquemines LNG. Based on historical pipeline usage in the region, we expect flows to Plaquemines to cap around 2.6 Bcf/d during the summer months as the new LNG facility competes for supply with utilities in Florida and surrounding states.
However, the latest pipeline samples show Plaquemines LNG is already pulling as much as 2.7 Bcf/d (see figure). Over half of these volumes are coming from Tennessee Gas Pipeline (TGP), from as far north as Station 860 in Centerville, TN.
On TGP, Station 534 at the Mississippi-Louisiana border has seen a significant increase in throughput to meet Plaquemines demand, reaching as high as 1.2 Bcf/d. Those volumes are coming from Midcontinent Express Pipeline (MEP) and the Southern Natural (Sonat) and Transcontinental (Transco) systems. MEP contributes nearly 400 MMcf/d starting in 2025, and Sonat and Transco have delivered a steady ~300 MMcf/d combined. We assume the remaining ~500 MMcf/d is coming further upstream on TGP, potentially from the Northeast.
There is also significant daily variation in deliveries to Plaquemines. When TGP flows fell to zero in early May, both Texas Eastern (TETCO) and Columbia Gas Transmission (CGT) picked up the slack for several days until TGP volumes returned. Only a few days later, on May 13, deliveries to Plaquemines hit an all-time high of 2.7 Bcf/d, despite TGP only flowing 960 MMcf/d. And on May 15, TGP volumes doubled to 1.88 Bcf/d, despite total feedgas intake dropping below 2.5 Bcf/d.
See the Southeast Gulf S&D report for more information. EDA expects summer premiums at Transco Station 85 will soon make these TGP molecules less economical for Venture Global (VG). However, the company is certainly willing to push the limits of its new infrastructure while prices allow. Feedgas volumes likely will settle into a steadier rhythm once the facility is completed and commercial operations begin in late 2026. For now though, volatility in the Southeast is the status quo.
Rigs:
The US rig count decreased by 1 for the May 24 week, standing at 540. The Bakken (-1), Eagle Ford (-4) and Permian (-2) lost rigs while the Anadarko and ArkLaTex gained 1 rig.
On the midstream side, Enterprise Products (EPD) is down 1 rig net with losses on its Permian and Eagle Ford systems. Kinetik (KNTK) is down 2 rigs total with losses on its Permian systems. See East Daley’s weekly Rig Activity Tracker for more information.
Flows:
US natural gas volumes averaged 69.6 Bcf/d in pipeline samples for the week ending June 1, down 0.5% W-o-W from 69.9 Bcf/d the previous week.
Liquids-driven basins decreased 1.2% to 18.0 Bcf/d. The Permian Basin sample decreased 3.3% W-o-W to average 5.7 Bcf/d, while the Eagle Ford gained 1.0% to 1.7 Bcf/d.
Gas-driven basins rose 0.4% W-o-W, averaging 44.1 Bcf/d. The Haynesville sample increased 0.9% to 10.5 Bcf/d. The Marcellus+Utica was relatively flat at 32.8 Bcf/d.
Storage:
Traders and analysts expect the Energy Information Administration (EIA) to report a 111 Bcf injection for the week ending May 30. A 111 Bcf injection would be 13 Bcf greater than the 5-year average, bumping the surplus to 106 Bcf. The storage deficit to last year would fall by 17 Bcf to 299 Bcf.
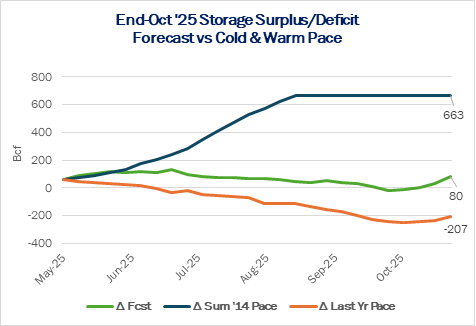
After last week’s 101 Bcf injection, the market is now looking at six straight weeks of triple-digit injections. That would best the run of five consecutive 100+ Bcf weekly injections in 2019 and fall just one shy of 2014’s run of seven triple-digit injections, from early May through June 20 of that year. Preliminary estimates for the week ending June 6 range from 95 Bcf to 105 Bcf, so a seventh triple-digit injection could happen. This would be a rare and unprecedented run, and sets up a potentially volatile scenario for prices.
The prompt-month July contract was trading at a nearly $0.90/MMBtu premium to Henry Hub cash this week in anticipation of increased demand in June and July. As the July Henry Hub contract marches toward expiry over the next three weeks, a meltdown of the prompt month could be in the making if demand doesn’t materialize to the market’s expectations. For the moment, storage injections are following a colder summer 2014 trajectory. If injections do not slow down, it could be a bumpy ride this summer.
Calendar:

Subscribe to East Daley’s The Daley Note (TDN) for midstream insights delivered daily to your inbox. The Daley Note covers news, commodity prices, security prices, and EDA research likely to affect markets in the short term.