


Executive Summary: Infrastructure: Rising gas prices could exert downward pressure on Northeast NGL production. Rigs: The total US rig count decreased by 1 during the week of March 2 to 564. Liquids-driven basins decreased by 6 W-o-W to 462. Flows: Total US pipeline volumes increased slightly to 70.1 Bcf/d for the week ending March 14, up from 69.9 Bcf/d the prior week. Calendar: March 27th – Plant Data – Ethane SD – Propane SD
Infrastructure:
- Higher natural gas prices create risk to NGL supply growth in the Northeast. Henry Hub futures from April to December ‘25 average $4.50/MMBtu, double the $2.20 average realized price for the same period last year.
- Gas prices are climbing following a relatively cold winter that has erased a longstanding storage surplus. Demand is growing for LNG exports and for power to fuel data center projects. See East Daley Analytics’ Macro Supply & Demand Report for more information.
- Historically, Appalachian producers target drier windows in the Marcellus and Utica when gas prices are high. This means less liquids are eventually recovered.
- The chart shows the relationship between Antero Resources’ (AR) average realized gas price and its c3+ liquids production. Both Range Resources (RRC) and AR, two of the leading operators in the Northeast liquids window, have guided to flat liquids production from 2024 to ‘25.
- What this means: EDA expects Northeast NGL production to grow by 45 Mb/d in 2025 in the NGL Hub Model. Rising gas prices and producer guidance pose downside risk to our forecast.
- Why it matters: The Northeast is the second-largest NGL producing basin in the US. Stagnation in production would open opportunities elsewhere to make up the supply.

Rigs:
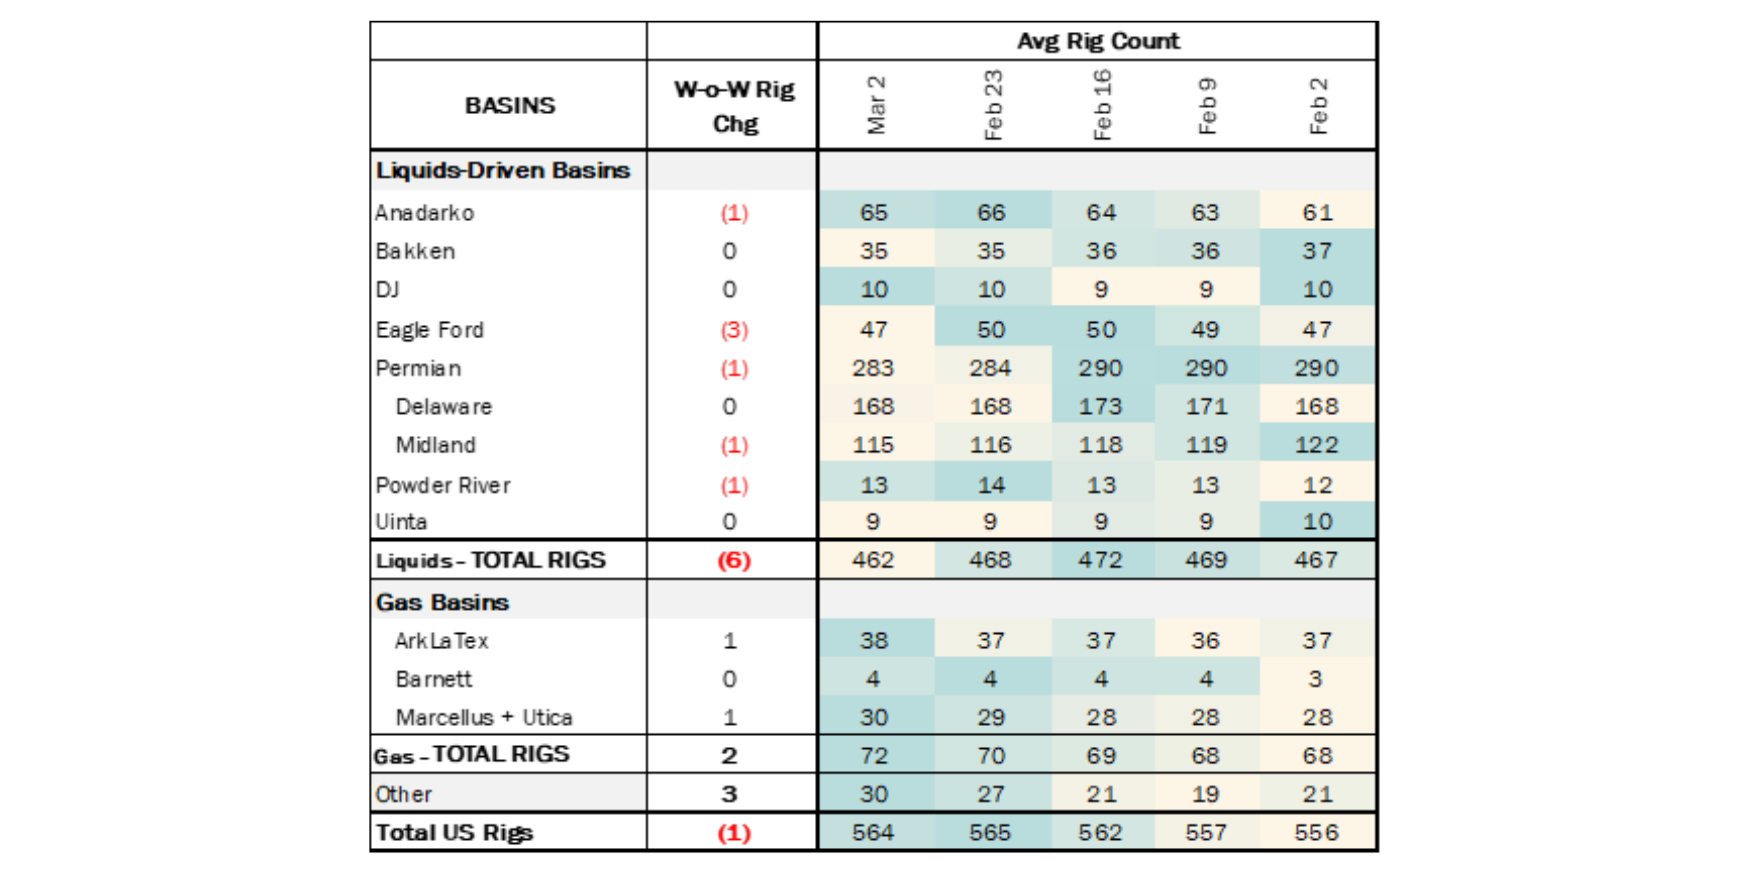
The total US rig count decreased by 1 during the week of March 2 to 564. Liquids-driven basins decreased by 6 W-o-W to 462.
- Eagle Ford (-3): EOG Resources, Kimmeridge Texas Gas, Magnolia Oil & Gas
- Anadarko (-1): JEL Resources
- Permian – Midland (-1): Firebird Energy II
- Powder River (-1): Anschutz

Flows:
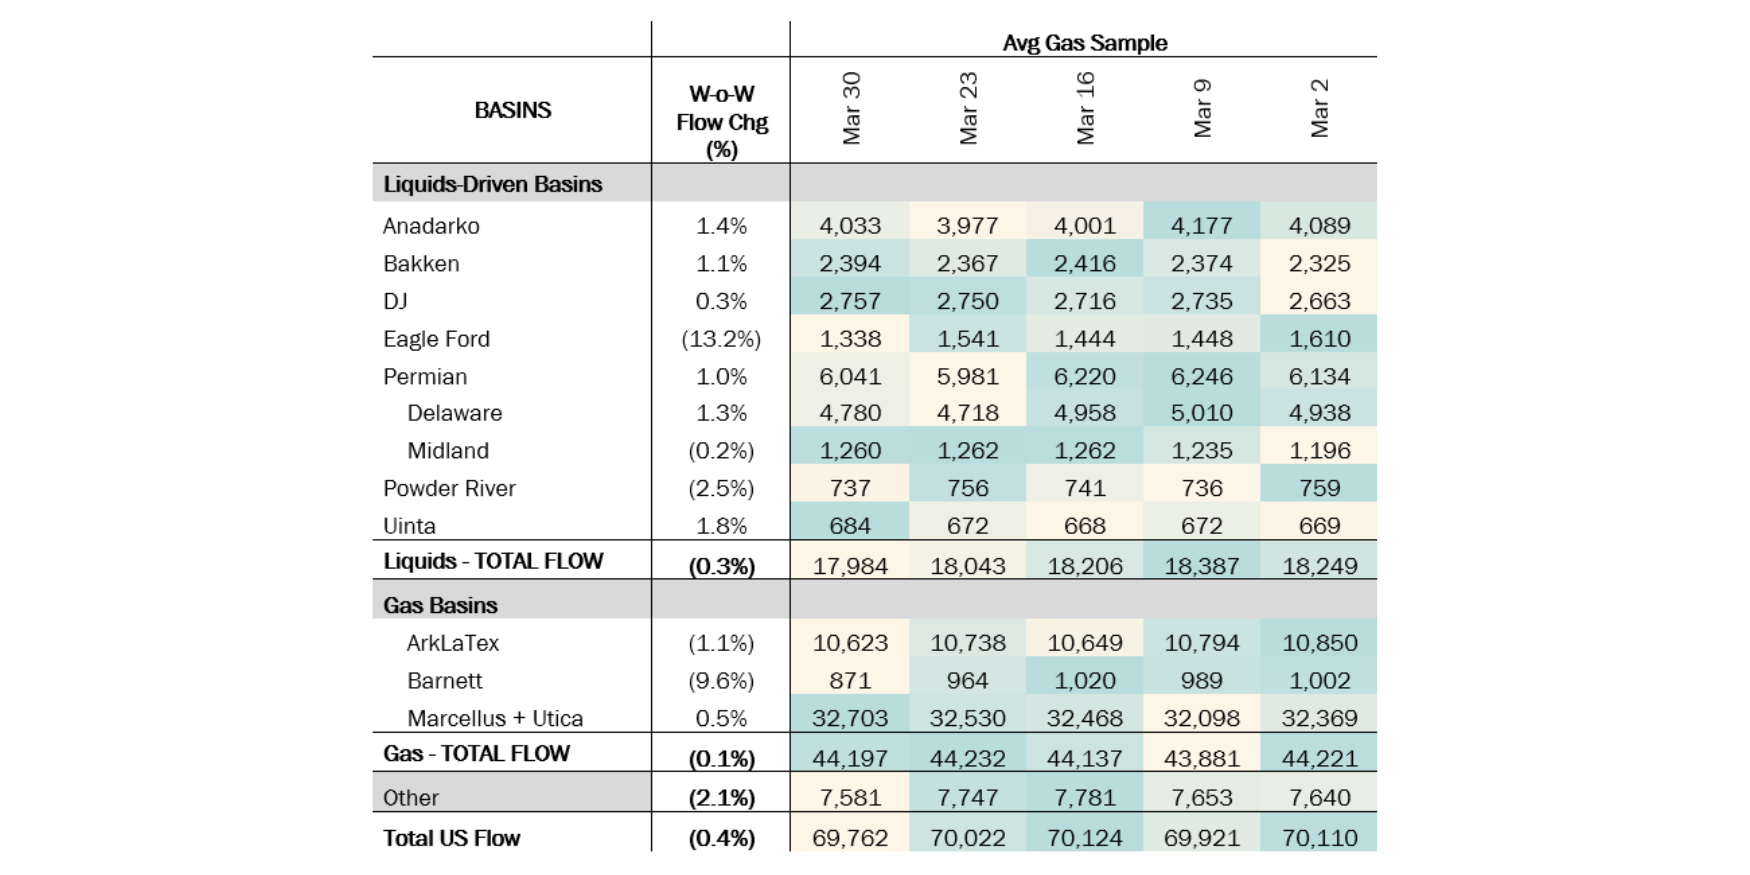
Total US pipeline volumes increased slightly W-o-W to 70.1 Bcf/d for the week ending March 14, up from 69.9 Bcf/d the prior week. Despite the increase, current volumes remain ~384 MMcf/d below February’s peak levels.
Liquids-driven basins saw a 1% decrease W-o-W, with volumes declining from 18.4 Bcf/d to 18.2 Bcf/d. The Anadarko Basin posted a 4% loss, decreasing from 4.17 Bcf/d to 4.01 Bcf/d, while the Bakken rose 2% from 2.37 Bcf/d to 2.41 Bcf/d. The Permian Basin is relatively flat W-o-W, averaging 6.22 Bcf/d.
In contrast, gas-driven basins increased 1% W-o-W, rising from 43.8 Bcf/d to 44.1 Bcf/d. The Appalachian Basin rose by 1%, from 32.09 Bcf/d to 32.47 Bcf/d, an increase of ~370 MMcf/d. The Haynesville saw decrease of 145 MMcf/d, declining from 10.79 Bcf/d to 10.65 Bcf/d.
These two basins — Appalachia and Haynesville — will be crucial to monitor in the coming months. With US natural gas storage now below the 5-year average following substantial withdrawals in February, ramping up production in these regions will be key to balancing supply and demand.


-1.png)


-1.png)
-3.png)