


Executive Summary: Infrastructure: Waha natural gas prices have turned negative, setting up the ethane market for increased supply this spring. Rigs: The total US rig count decreased by 5 during the week of March 16 to 549. Liquids-driven basins decreased by 2 W-o-W to 455. Flows: For the week ending March 30, US natural gas pipeline samples averaged 69.8 Bcf/d, a modest W-o-W decline from 70.0 Bcf/d the previous week. This represents the lowest average observed in March. Calendar: Bakken and Northeast Ethane Basin S&Ds will be published.
Infrastructure:
Waha natural gas prices have turned negative, setting up the ethane market for increased supply this spring. Producers and processors in the Permian Basin will raise ethane recovery to reduce losses when gas prices sink, a trend illustrated by the relationship between falling Waha prices (blue line) and rising ethane supply (orange line) in the figure.
The relationship was clear in 2024, when Waha frequently traded below zero due to restricted pipeline takeaway. Producers trapped in the basin faced a stark choice: recover more ethane to cut losses, or lose money on gas production. Permian ethane production hit multiple monthly record highs as a result. With Mont Belvieu ethane prices now hovering around $0.30/gal (~50% more than 2024’s average), there’s more incentive for producers to prioritize ethane recovery.

The start of the Matterhorn pipeline in October ’24 provided needed relief for gas takeaway constraints in West Texas, and Waha prices did recover over the winter. But active pipeline maintenance this month on Gulf Coast Express and Permian Highway Pipeline is pressuring prices once again. The forward curve reflects expectations for a moderate, slow recovery for the rest of 2025. The situation remains tight, with gas pipelines running nearly full and byproduct ethane likely to play savior to margins for the near future. We forecast continued ethane supply growth as a result.
Rigs:
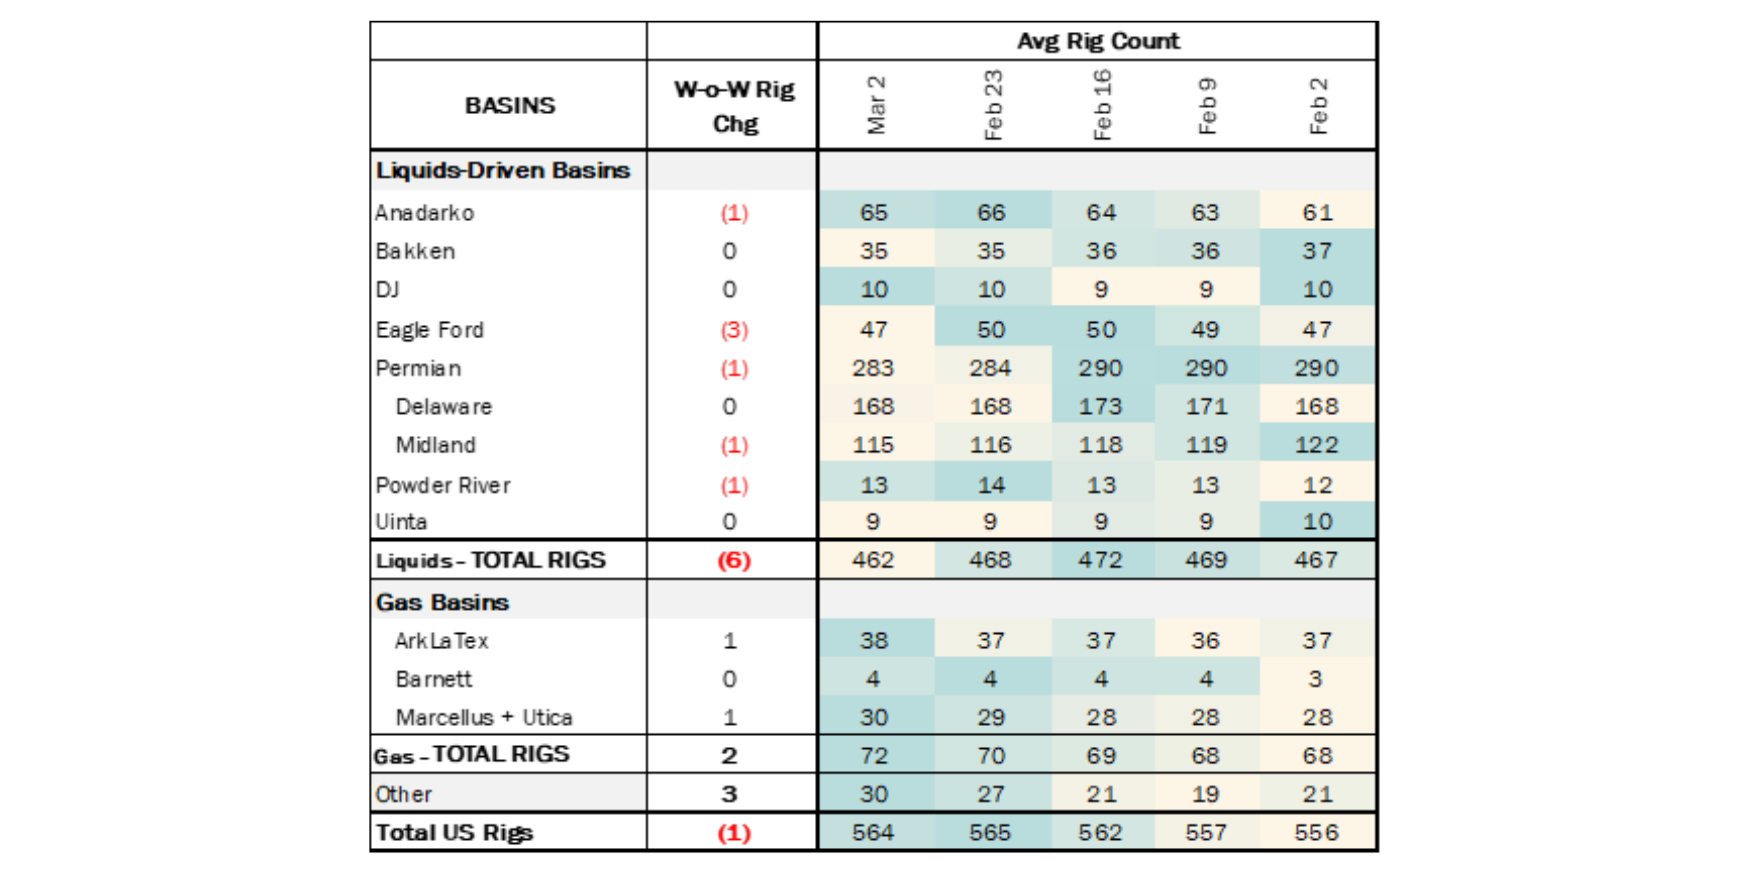
The total US rig count decreased by 5 during the week of March 16 to 549. Liquids-driven basins decreased by 2 W-o-W to 455.
- Permian (-3):
- Midland (-2): Exxon, SM Energy
- Delaware (-1): Mewbourne Oil
- Bakken (-2): Hess Corporation, ConocoPhillips
- Uinta (-1): Koda Resources
- Anadarko (3): American Warrior, Mad Operators LLC, Murfin Drilling Company Inc
- Eagle Ford (1): BP
Flows:
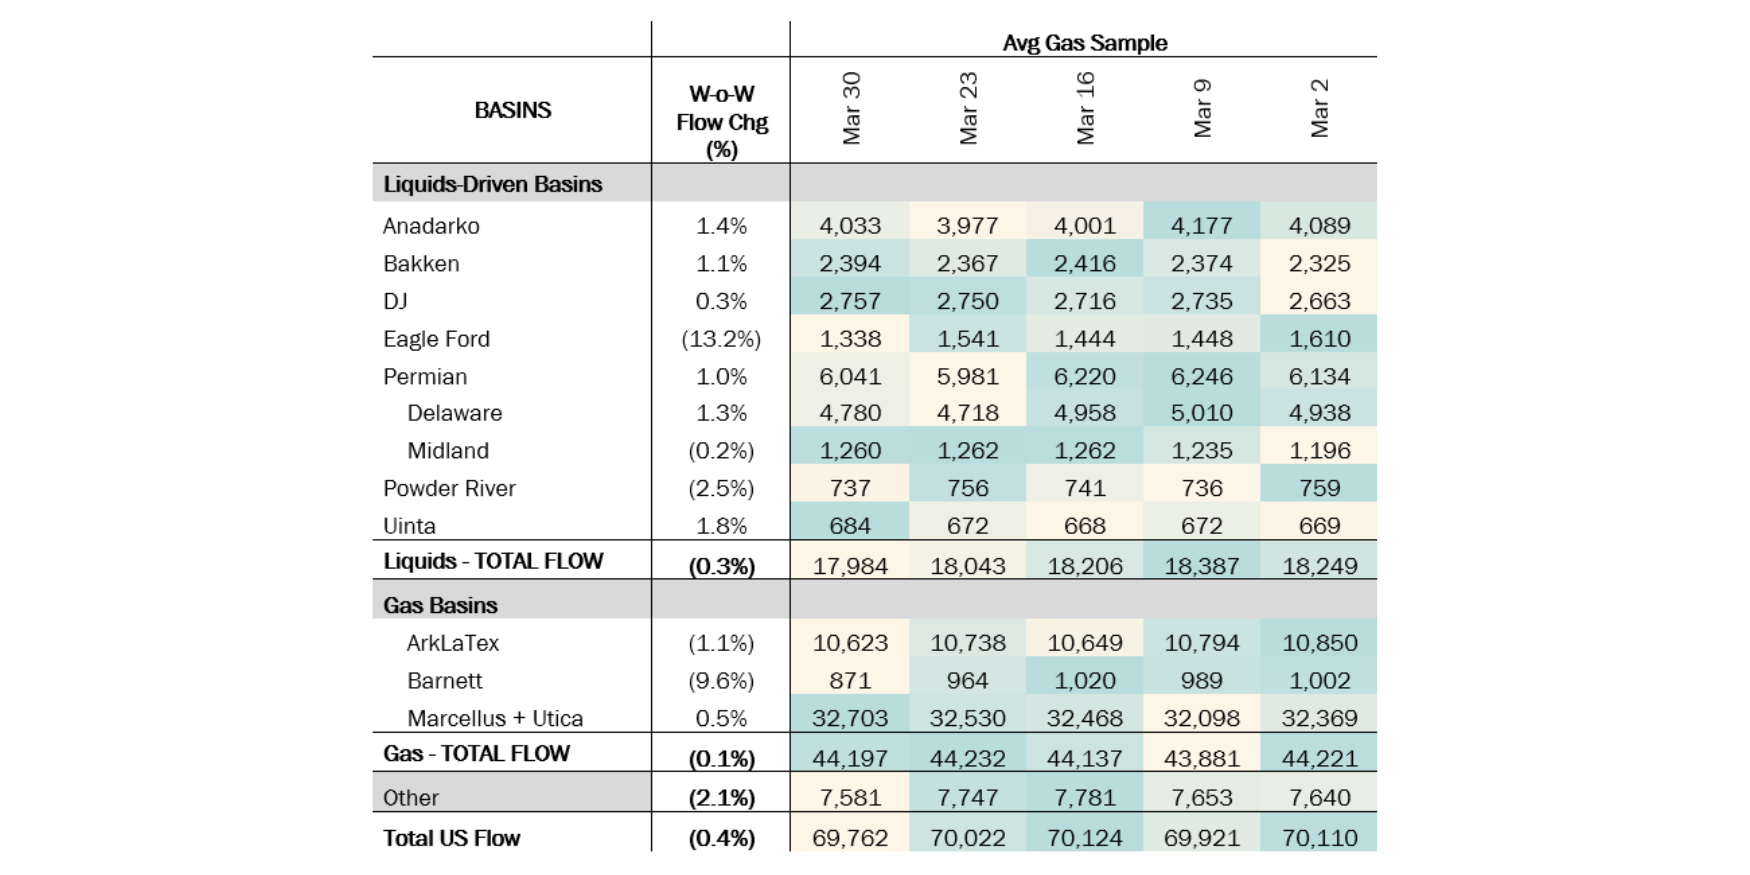
For the week ending March 30, total U.S. pipeline natural gas volumes averaged 69.8 Bcf/d, marking a modest W-o-W decline from 70.0 Bcf/d the previous week. This represents the lowest average observed in March.
Liquids-driven basins were relatively stable, experiencing a minor W-o-W decrease of 60 MMcf/d to bring the average to 17.9 Bcf/d. The Permian Basin posted a slight gain of 1%, increasing by 60 MMcf/d, while the Anadarko Basin saw a 1.4% rise, growing from 3.94 Bcf/d to 4.03 Bcf/d.

Gas-driven basins also held steady on a W-o-W basis, maintaining an average flow of 44.2 Bcf/d. Within this segment, Haynesville declined by 1.1%, falling from 10.7 Bcf/d to 10.6 Bcf/d — a reduction of ~115 MMcf/d. This decrease was counterbalanced by a 0.5% increase in Appalachia, which averaged 32.7 Bcf/d.
Looking ahead, the Appalachia and Haynesville will be pivotal basins to monitor. With US natural gas storage levels now below the 5-year average due to significant withdrawals in February, increased production from these regions will be critical to restoring balance between supply and demand.
Calendar:


-1.png)


-1.png)
-3.png)