


Executive Summary: Infrastructure: An escalating trade war with China could put some LPG exports at risk. Rigs: The total US rig count decreased by 2 for the week of February 23 to 555. Liquids-driven basins decreased by 5 W-o-W to 463. Flows: Total US pipeline samples declined 0.3% W-o-W for the March 9 week, from 70.1 Bcf/d to 69.9 Bcf/d. Calendar: Plant data will be updated March 17 and the NGL forecast will be updated March 20.
Meet East Daley in Houston: East Daley will be in Houston March 19–21. If you would like to schedule an NGL market update, click here.
Infrastructure:
- The Trump administration has imposed a 20% tariff on Chinese goods. China has retaliated with 10-15% tariffs on agricultural products, although energy imports including propane have been spared so far.
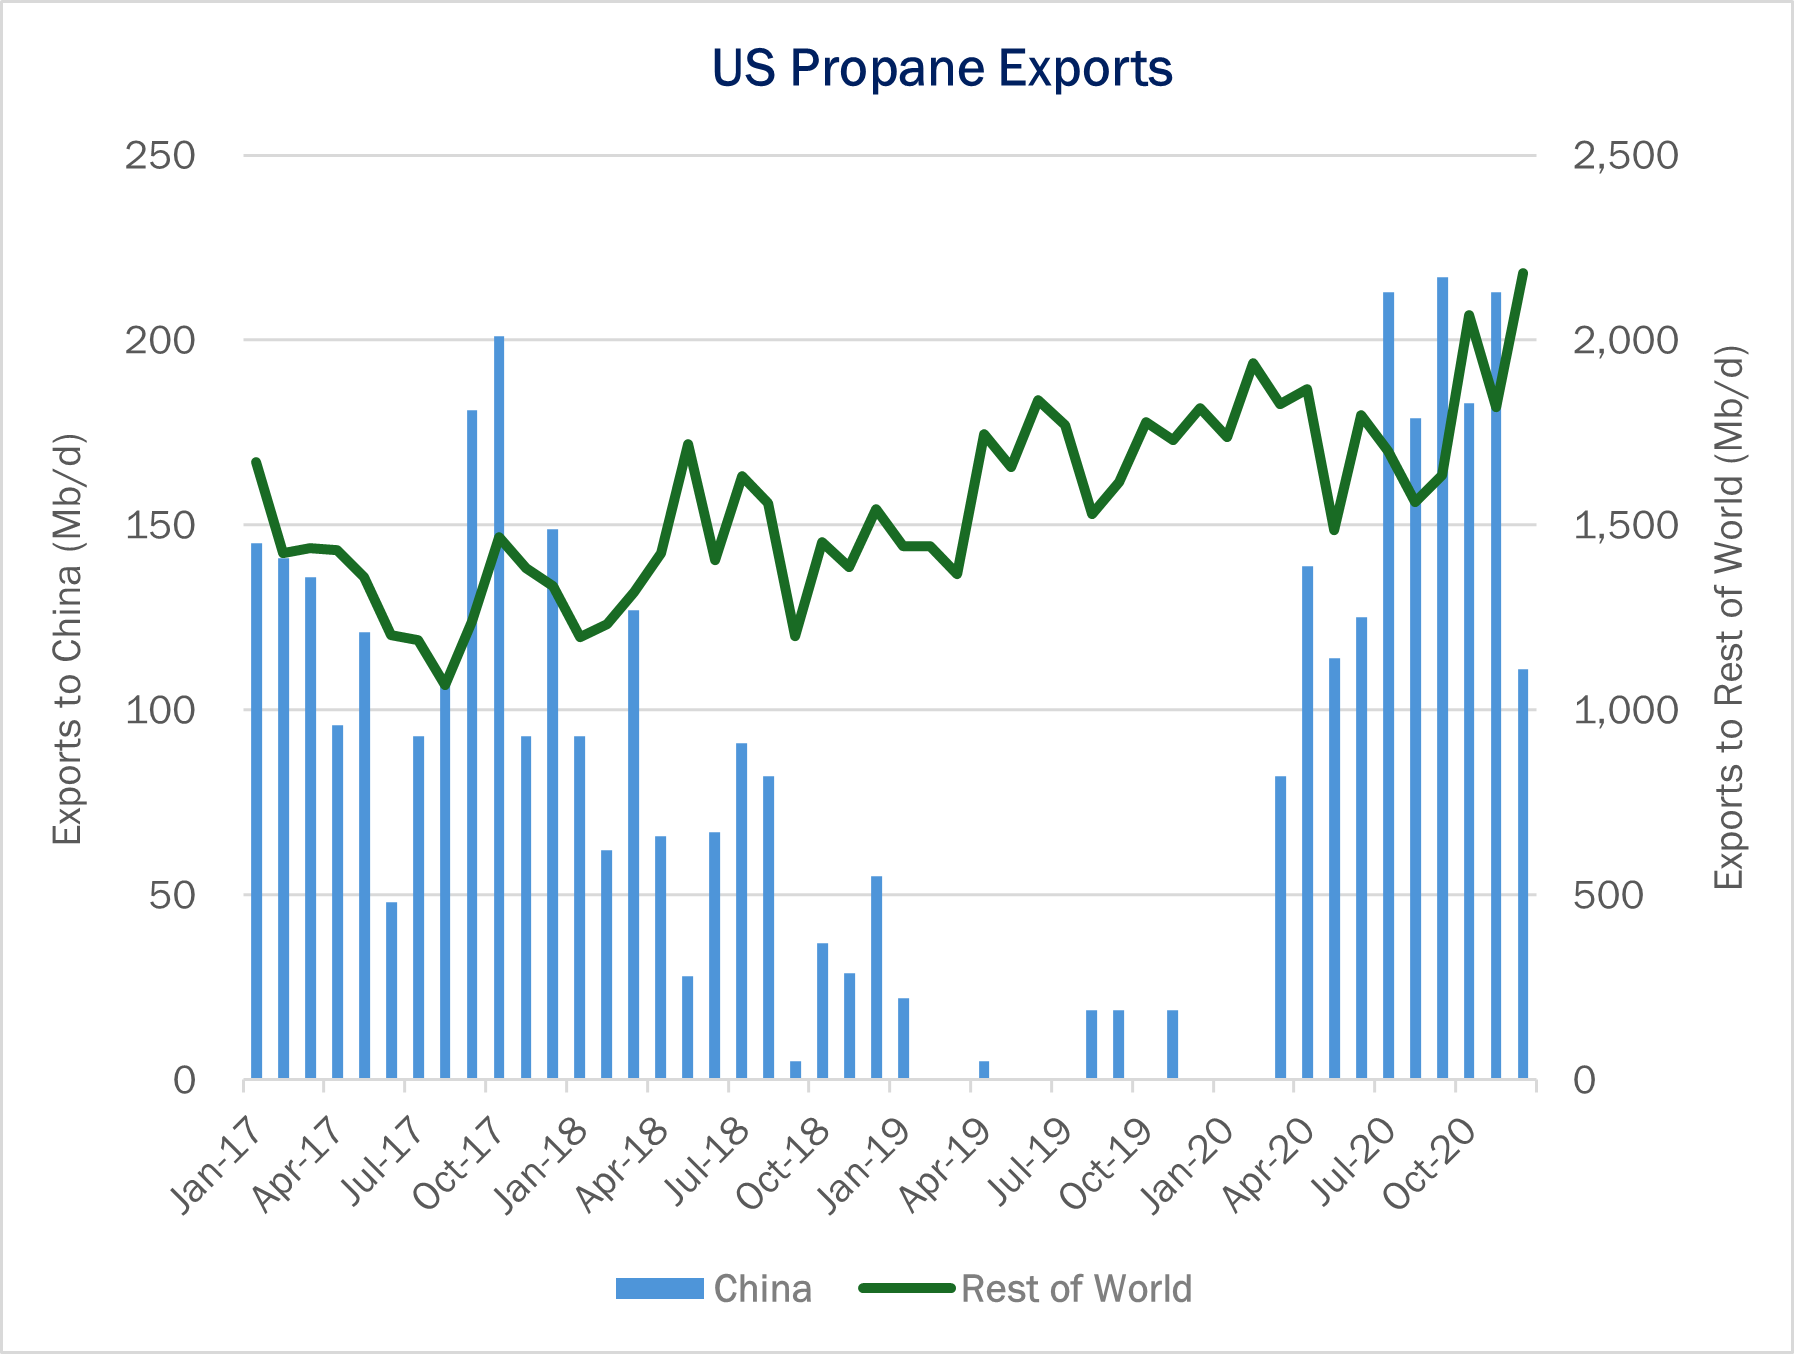
- We can look to the recent past for an understanding of what retaliatory tariffs have done to the US LPG export market. In August ’18, China imposed a 25% tariff on US propane as part of its retaliation against US tariffs during the 2018-19 US-China trade war. Propane exports to China fell from 200 Mb/d in Oct ’17 to zero by Feb ’18 (see the blue bars in the chart below).
- While the change to trade policy introduced uncertainty and volatility into the market, overall LPG exports grew by 183 Mb/d (+20%) from 2017 to ’19. US propane exports increased by 158 Mb/d (+75%) during that same period as other countries like South Korea, Taiwan and Indonesia also imported more US propane.
- China met its own demand from a growing number of propane dehydrogenation (PDH) facilities in the Middle East including in Saudi Arabia, the United Arab Emirates and Qatar. In the end, the trade war introduced volatility into a fast-growing global market for propane, and EDA believes we can expect the same themes if tariffs begin to target energy. The larger concern is dampened economic growth. The tariffs can increase transportation and logistics costs and contribute to a higher inflationary environment.
Rigs:
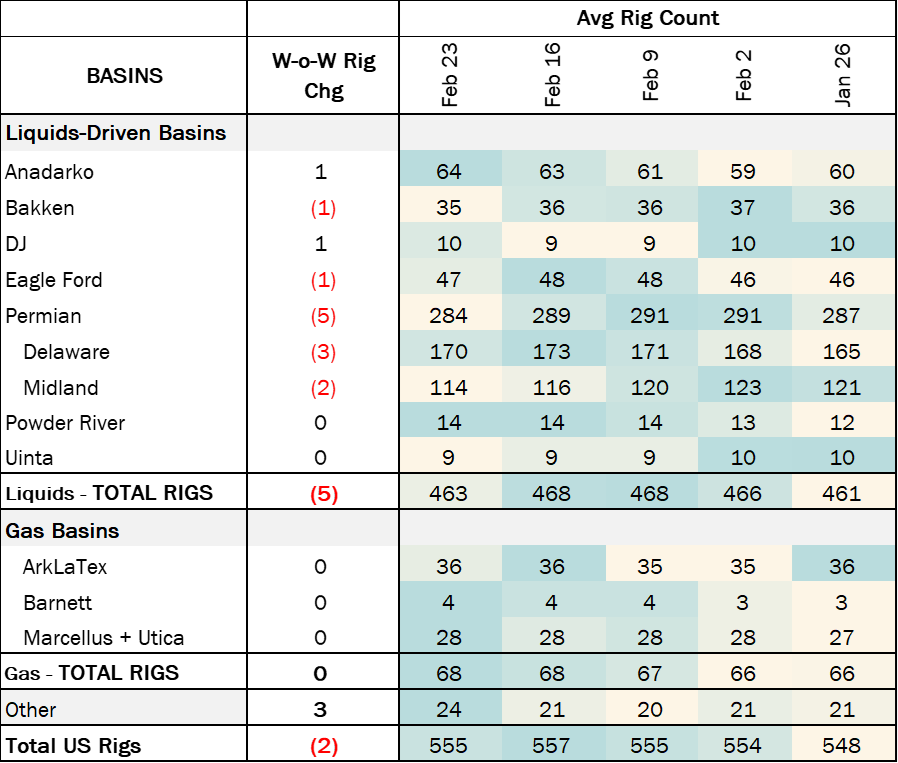
The total US rig count decreased by 2 during the week of February 23 to 555. Liquids-driven basins decreased by 5 W-o-W to 463.
- Permian (-5):
- Midland (-3): Exxon Mobil, Moriah Operating, Highpeak Energy
- Delaware (-2): Mewbourne Oil, ConocoPhillips
- Bakken (-1): Continental Resources
- Anadarko (+1): Crawley Petroleum
- DJ (+1): North Peak Oil & Gas
Flows:
Total US pipeline volumes decline slightly from last week and are ~587 MMcf/d below February’s peak levels. Natural gas pipeline samples declined 0.3% W-o-W for the March 9 week, from 70.1 Bcf/d to 69.9 Bcf/d.
Liquids basins increased by 0.8%. The Anadarko, Bakken and DJ basins all increased by 2%, averaging a gain of ~70 MMcf/d. The Permian Basin, despite a weak correlation between pipeline samples and actual production, also grew 1.8%. However, despite a weak correlation between pipeline samples and actual production, this may be overstating any real production change.
Gas basin samples decreased 0.8%, with most of the decline coming from Appalachia (~271 MMcf/d) while the Haynesville decreased ~60 MMcf/d. These two basins will be crucial to monitor in the coming months, as they will need to ramp up production. This is particularly important as total US storage has fallen below the 5-year average following substantial withdrawals in February.

Data Points & Product Release Calendar:
